·Clinical Research·
Quantitative analysis of retinal ischemia in diabetic retinopathy and its correlation with diabetic macular edema
Jiang Jingwen, Chen Changzheng, Sun Gongpeng, Wang Xiaoling, Yi Zuohuizi
Eye Center, Renmin Hospital of Wuhan University, Wuhan 430060, China
Corresponding author: Chen Changzheng, Email: whuchenchzh@163.com
[Abstract] [Download PDF in English] [Download PDF in Chinese] [Read Full Text]
Objective To quantitatively evaluate retinal ischemia in different retinal regions of diabetic retinopathy (DR) patients in ultra-widefield fluorescein fundus angiography (UWFA) images applying the ischemic index (ISI), and to investigate its correlation with diabetic macular edema (DME).
Methods A cross-sectional study was conducted. Seventy-nine eyes of 79 patients with DR were enrolled at the Renmin Hospital of Wuhan University from September 2017 to October 2020, including 44 males (44 eyes) and 35 females (35 eyes) aged 31–73 years, with a mean age of 55.95±8.80 years. UWFA and spectral-domain optical coherence tomography were performed in all patients. Patients were assigned to the DME (37 eyes) or non-DME group (42 eyes) according to the presence or absence of DME in OCT images. The retina in middle-phase UWFA images was divided into posterior, mid peripheral and far peripheral regions using ImageJ software, and the ISI in each region was calculated. Central macular thickness (CMT) was automatically calculated using the built-in software of the OCT equipment. The correlation between the ISI and CMT was analyzed by Spearman’s rank correlation analysis.
Results The ISI of the total, posterior, middle peripheral and far peripheral retina was 2.460 (0.603, 5.640), 2.670 (1.062, 9.574), 1.382 (0.245, 4.378) and 0.000 (0.000, 1.262)%, respectively, with a statistically significant difference (χ2=65.307, P<0.001). There were statistically significant differences in the ISI between the total and far peripheral, the posterior and middle peripheral, the posterior and far peripheral and the middle peripheral and posterior retina (all P<0.01). The ISI of the total, posterior and middle peripheral retina in the DME group were significantly higher than those in the non-DME group (U=424.000, P=0.001; U=403.000, P<0.001; U=493.000, P=0.005, respectively), whereas there was no significant difference in the ISI of the far peripheral region between the two groups (U=609.000, P=0.061). There was not statistically significant correlation between the ISI and CMT in the total, posterior, middle peripheral or far peripheral retina in the DME group (rs=-0.134, rs=-0.018, rs=-0.152, rs=-0.163, respectively; all P>0.05).
Conclusions The retinal non-perfusion area in DR eyes was mainly located in the posterior and mid-peripheral retina. The ISI of the posterior and mid-peripheral retina in DME eyes was significantly higher than that in eyes without DME. The ISI of each retinal region may not be associated with DME severity.
[Key words] Diabetic retinopathy; Macular edema; Fluorescein angiography; Tomography, optical coherence
DOI: 10.3760/cma.j.cn115989-20201221-00856
Diabetic retinopathy (DR) is a common microvascular abnormality in diabetes mellitus. Diabetic macular edema (DME) secondary to DR has become a significant factor for severe visual loss in DR patients 1. Fluorescein fundus angiography (FFA) is an important examination in DR diagnosis and treatment. However, traditional FFA can only cover a range of 30–50° in a single shot, which is
insufficient when observing retinal vessels in the peripheral retina 2. Ultra-widefield fluorescein fundus angiography (UWFA) covers approximately 82% of the retina within a single imaging, which assists in observing the posterior pole of the fundus as well as the peripheral retina at the same time, increasing the opportunity to find peripheral retinopathy 3. Retinal ischemia is one of the important pathological changes in DR. With the progress of retinal hypoxia, decompensation of retinal capillaries contributes to pathological capillary occlusion, which is present as a non-perfusion zone in FFA images. On the basis of seven-field standard FFA imaging, most previous studies used the disc area to quantify the non-perfusion zone in DR eyes. On the basis of UWFA, the ischemic index (ISI) is defined as the percentage of non-perfusion area to total retinal area after manually depicting the retinal boundary and non-perfusion area on UWFA images 5. Studies have shown that the ISI can be used as a reliable indicator to assess retinal ischemia in retinal vascular diseases, including DR and retinal vein occlusion 4-7. However, the correlation between the ISI and DME is currently unclear. The current study aims to use the ISI to estimate retinal ischemia in different regions of DR eyes and investigate its relationship with DME.
1 Methods
- Patients and materials
This cross-sectional study included 79 eyes from 79 patients, with 44 eyes from 44 males and 35 eyes from 35 females at the Renmin Hospital of Wuhan University from September 2017 to October 2020. The mean age of the included patients was 55.95±8.80 (mean ± standard deviation) years. There were 36 non-proliferative diabetic retinopathy eyes and 43 with proliferative diabetic retinopathy (PDR). All patients received best–corrected visual acuity testing, slit lamp examination, ultra-wide-field fundus photography, UWFA and spectral-domain optical coherence tomography (SD-OCT). The inclusion criterion was: Patients diagnosed as displaying DR based on the Guidelines for the clinical diagnosis and treatment of diabetic retinopathy in China (2014)8. Exclusion criteria were: (1) refractive interstitial opacity, vitreous hemorrhage etc. affect image quality; (2) patients with other retinal vascular diseases, including uveitis and retinal vein occlusion; (3) patients with macular lesions such as of the epiretinal membrane and macular hole; (4) patients have received treatments including photocoagulation, intravitreal injection of anti-vascular endothelial growth factor (VEGF) drugs and vitreoretinal surgery among others. On the basis of the Chinese guidelines for the diagnosis and treatment of diabetic retinopathy (2014), two experienced ophthalmologists classified the eyes into the DME (n=37) and non-DME groups (n=42) according to the retina within two disc areas from the center of the macular in the optical coherence tomography (OCT) image. There was no statistical difference in sex, age or DR stage between the two groups (all P>0.05) (Table 1). The study was approved by the Institutional Review Board of the Renmin Hospital of Wuhan University (WDRY2019-K037) and conducted in accordance with the tenets of the Declaration of Helsinki. All patients knew the purpose of the study and signed the informed consent form.

1.2 Methods
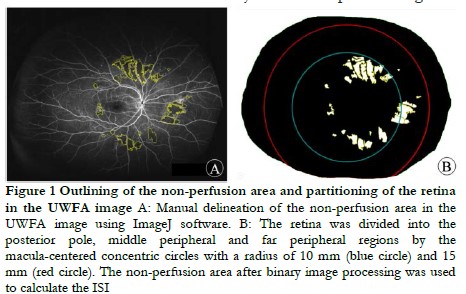
1.2.1 UWFA examination and image processing The UWFA examination was performed by the same experienced ophthalmologist on the UK Optos 200TX imaging system. The pupils of the patients was dilated with compound tropicamide eye drops (Santan Pharmaceuticle (China) CO., Lid., Beijing) and the patients received a 3 ml 10% fluorescein sodium injection via the antecubital vein. The UWFA image obtained in the middle stage (45 s–2 min) was compressed into a high-quality JPEG format image for export and analysis. The boundaries of the retina and non-perfusion area were manually outlined on ImageJ 2.0.0 software (National Institutes of Health, USA). The retina was divided into posterior pole, middle peripheral and far peripheral for data measurement and calculation by two senior ophthalmologists.
1.2.2 SD-OCT examination The examination of all patients was performed by an senior ophthalmologist, using the American Optovue RTVue OCT instrument with Retina Map mode. Scans were centered on the central macular fovea and a single scan included one horizontal scan and one vertical scan. The image quality was set as ≥ 8/10. The built-in software (version 2017.1.0.151) of the OCT device automatically measured the central macular thickness (CMT) of the macular fovea.
1.3 Statistics
SPSS 23.0 statistical software was used for statistical analysis. The Shapiro-Wilk test was used to test the normality of the measurement data. Age of the patients in this study was normally distributed and was expressed as a±s . The remainder of the measurement data were non-normally distributed, represented by M (Q1, Q3). The difference in the ISI among retinal regions was compared with the Freidman’s test, and the significance level was corrected by α’=0.05/6=0.008 by Bonferroni. The χ2 test was used to compare the distribution of eye numbers by sex and stage between the groups. The difference between the groups in the ocular ISI was compared by the Mann-Whitney U test. The Spearman’s rank correlation test was used to analyze the correlation between the ISI and CMT in the DME group. P<0.05 was considered to be statistically significant.
2 Results
2.1 Comparison of the ISI among different retinal regions
Among all the included DR eyes, the total retina, posterior pole, middle peripheral and far peripheral ISIs were 2.460 (0.603, 5.640), 2.670 (1.062, 9.574), 1.382 (0.245, 4.378) and 0.000 (0.000, 1.262)%, respectively (χ2=65.307, P<0.001). Among them, the difference of the ISIs between panretina vs. far peripheral retina, posterior pole vs. middle peripheral retina and posterior pole vs. far peripheral retina were all statistically significant (all P<0.001). No statistical significance was found in the ISIs between panretina vs. posterior pole or panretina vs. middle peripheral retina (P=0.082, P=1.000).
2.2 Comparison of the ISI in different retinal regions between the two groups
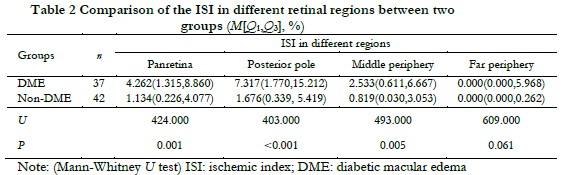
The ISIs in the panretina, posterior pole and middle peripheral retina in the DME group were significantly higher than those in the non-DME group (Z=424.000, P=0.001; Z=403.000, P<0.001; Z=493.000, P=0.005, respectively). The difference in the ISI in the far peripheral retina was not statistically significant between the two groups (Z=609.000, P=0.061) (Table 2).
2.3 Correlation between the ISI and CMT of different retinal regions in DME group
The CMT in the DME group was 401.000 (293.000, 537.500) μm. There was no significant correlation between the ISI and CMT in the panretina, posterior pole, middle peripheral or far peripheral regions of retina in DME group (rs=-0.134, P=0.428; rs=-0.018, P=0.914; rs=-0.152, P=0.368; rs=-0.163, P=0.335, respectively) (Figure 2).

3 Discussion
Retinal ischemia is one of the main pathological changes in DR, which is closely associated with complications such as retinal neovascularization and DME 7. Therefore, the quantitative study of the retinal non-perfusion area is essential. The ISI is a new indicator for the quantitative analysis of retinal ischemia in UWFA images, which is important in clinical DR diagnosis and treatment. However, the difference in the ISI between different retinal regions and their relationship with DME remains to be investigated. In the fovea, the cone density is extremely high and there is a rod-free zone whose diameter is 100–200 μm. The density of cones decreases sharply from the fovea to the far periphery, whereas the density of rods increases from the fovea outward, and attains its highest density at 3–5 mm from the fovea 10. Considering the distribution features of photoreceptors in the retina, we further divided the retina into three subregions and observed the distribution of retinal ischemia in these regions and its relationship with DME.
Our study showed that there was a significant difference in the degree of retinal ischemia among the subregions. Compared with the peripheral retina, the ISI value was larger in the posterior pole and middle peripheral retina. We propose that photoreceptors consume more energy 11, thus the posterior pole or mid-periphery with a high photoreceptor density are more susceptible to ischemia. Additionally, more VEGF produced in the posterior pole and the mid-periphery exacerbates retinal ischemia. A previous study including 40 eyes from 29 DR patients showed that the ISI in the far peripheral region was higher than in other regions 12. This inconsistent result may be related to the racial differences in patients and the different proportion of PDR eyes. The distribution characteristics of the retinal ischemia in DR eyes still need to be confirmed by further studies with larger sample sizes.
The structural injuries in retinal vascular endothelial cells and pericytes caused by hyperglycemic environments lead to retinal ischemia and blood-retinal barrier destruction 13. A variety of cellular molecules involved in DME and VEGF play an important role in the progression of DME. Retinal ischemia upregulates VEGF expression, leading to increased vascular permeability and the occurrence of DME 14-16. Wessel et al. 17 retrospectively analyzed 122 eyes in 70 DR treatment-naïve patients and found that ISI levels were positively correlated with the presence of DME. Patel et al. 18 came to a similar conclusion. In our study, ISIs of the panretina, posterior pole, mid-periphery and far periphery were significantly higher in the DME group compared with the non-DME group. Consistent with previous studies, the results demonstrated that there was a strong association between retinal ischemia and DME. Many recent UWFA studies found the presence of avascular areas in the far peripheral retina of some normal eyes 19-21, suggesting that nonperfusion areas in the far periphery could be physiological. Some studies have been conducted to investigate the boundaries of the normal ocular retinal vasculature and provided a reference for the physiological nonperfusion area 19-21. However, further studies are needed to determine the nonperfusion area in the far periphery of DR and determine its relationship with DME.
In DR eyes, the occlusion of retinal capillaries leads to retinal ischemia and a nonperfusion area, and the secondary accumulation of VEGF triggers DME. Similar with previous studies 22, the results in our study showed that the ISIs in all subregions were not associated with the CMT in DME eyes, suggesting that DME severity may be associated with other pathological factors. A study performing UWFA examinations on 264 eyes with DR showed that peripheral vascular leakage could lead to DME 23. In addition, Fang et al. 24 showed that DME severity was positively correlated with the leakage of non-perfusion area with. Both these studies indicated that retinal vascular leakage may affect DME occurrence. On the basis of the definition of the ISI, Sim et al. 25 proposed the leakage index, which is the percentage of total vascular leakage pixels in the total number of retinal pixels on UWFA images. They found that in the eyes of untreated DR patients, the peripheral vascular leakage index was positively correlated with the ISI, with a correlation coefficient of 0.44, suggesting a potential association between leakage and ischemia. However, research on the leakage index of DR is relatively limited, and a large number of studies are still needed to further investigate its relationship with the ISI and DME.
There were some limitations in the current study. First, it was a cross-sectional study at a single center with a limited sample size and did not analyze the prognostic value of the ISI on DME. Second, the peripheral distortion of the UWFA imaging system may have led to a calculation error of the ISI. Singer et al. 21 used the montage to correct the peripheral distortion of UWFA, and the results showed that the error between the corrected and uncorrected data was only 1%. The correction analysis could be used in further study to reduce the error. Third, a single UWFA image in the primary eye position may not fully expose the far peripheral retina, resulting in an error of the ISI calculation. Finally, because some eyes were excluded due to the opacity of the refractive media and other factors affecting image quality, there may have been a bias in the included PDR eyes.
In conclusion, the retinal non-perfusion area of the DR eye was mostly located in the posterior pole and middle peripheral retina. The ISI of the DME eye was higher than that of the non-DME eye, and there was no clear correlation between the ISI and CMT in DME eyes. The correlation between the ISI and DME prognosis and that between the ISI and different types of DME needs to be investigated in further studies.
Conflict of interest All authors declare that there is no conflict of interest.
Author contribution statement Jiang Jingwen: research conduction, data collection and analysis, paper writing and revision; Wang Wenyu: paper writing. Chen Changzheng: conceptualization, supervision, paper writing and revision; Sun Gongpeng: data analysis; Wang Xiaoling and Yi Zuohuizi: data collection
References
[1] Lu YY, Dai H. Treatment strategy and plan for diabetic macular edema based on the latest guidelines[J]. Chin J Exp Ophthalmol, 2018, 36(6):401-403. DOI: 10.3760/cma.j.issn.2095-0160.2018.06.001.
[2] Chen CZ, Xu AM. Improve our understanding of ocular fundus diseases with ultra-wide-field fluorescein angiography[J]. Chin J Ocul Fundus Dis, 2017, 33(1):7-9. DOI: 10.3760/cma.j.issn.1005-1015.2017.01.003.
[3] Silva PS, Cavallerano JD, Sun JK, et al. Nonmydriatic ultrawide field retinal imaging compared with dilated standard 7-field 35-mm photography and retinal specialist examination for evaluation of diabetic retinopathy[J]. Am J Ophthalmol, 2012, 154(3):549-559. DOI: 10.1016/j.ajo.2012.03.019.
[4] Chen CZ, Wang XL. To correctly analyze ultra-wide field fluorescein angiography in peripheral retina[J]. Chin J Exp Ophthalmol, 2020, 38(7): 562-565. DOI: 10.3760/cma.j.cn115989-20190401-00158.
[5] Thomas AS, Thomas MK, Finn AP, et al. Use of the ischemic index on widefield fluorescein angiography to characterize a central retinal vein occlusion as ischemic or nonischemic[J]. Retina, 2019, 39(6):1033-1038. DOI: 10.1097/IAE. 0000000000002126.
[6] Fan W, Nittala MG, Velaga SB, et al. Distribution of nonperfusion and neovascularization on ultrawide-field fluorescein angiography in proliferative diabetic retinopathy (RECOVERY Study): report 1[J]. Am J Ophthalmol, 2019, 206:154-160. DOI: 10.1016/j.ajo.2019.04.023.
[7] Jiang JW, Chen CZ. Application of ischemic index of ultra-widefield fluorescein angiography in retinal vascular diseases[J]. Chin J Exp Ophthalmol, 2022, 40(11):1100-1103. DOI: 10.3760/cma.j.cn115989-20190422-00194.
[8] Retina Disease Group, Chinese Society of Ophthalmology. Guidelines for the clinical diagnosis and treatment of diabetic retinopathy in China (2014)[J]. Chin J Ophthalmol, 2014, 50(11):851-865. DOI: 10.3760/cma.j.issn.0412-4081.2014. 11.014.
[9] Wessel MM, Aaker GD, Parlitsis G, et al. Ultra-wide-field angiography improves the detection and classification of diabetic retinopathy[J]. Retina, 2012, 32(4):785-791. DOI: 10.1097/IAE.0b013e3182278b64.
[10] Curcio CA, Sloan KR, Kalina RE, et al. Human photoreceptor topography[J]. J Comp Neurol, 1990, 292(4):497-523. DOI: 10.1002/cne.902920402.
[11] Narayan DS, Chidlow G, Wood JP, et al. Glucose metabolism in mammalian photoreceptor inner and outer segments[J]. Clin Exp Ophthalmol, 2017, 45(7):730-741. DOI: 10.1111/ceo.12952.
[12] Fan W, Wang K, Ghasemi Falavarjani K, et al. Distribution of nonperfusion area on ultra-widefield fluorescein angiography in eyes with diabetic macular edema: DAVE Study[J]. Am J Ophthalmol, 2017, 180:110-116. DOI: 10.1016/j.ajo. 2017.05.024.
[13] Lee SJ, Shin IC, Jeong IW, et al. Prospective, single-center, six-month study of intravitreal ranibizumab for macular edema with nonproliferative diabetic retinopathy: Effects on microaneurysm turnover and non-perfused retinal area[J]. Clin Ophthalmol, 2020, 14:1609-1618. DOI: 10.2147/OPTH.S248529.
[14] Simunovic MP, Maberley DA. Anti-vascular endothelial growth factor therapy for proliferative diabetic retinopathy: A systematic review and meta-analysis[J]. Retina, 2015, 35(10):1931-1942. DOI: 10.1097/IAE.0000000000000723.
[15] Figueira J, Silva R, Henriques J, et al. Ranibizumab for high-risk proliferative diabetic retinopathy: An exploratory randomized controlled trial[J]. Ophthalmologica, 2016, 235(1):34-41. DOI: 10.1159/000442026.
[16] Funatsu H, Yamashita H, Noma H, et al. Aqueous humor levels of cytokines are related to vitreous levels and progression of diabetic retinopathy in diabetic patients[J]. Graefe’s Arch Clin Exp Ophthalmol, 2005, 243(1):3-8. DOI: 10. 1007/s00417-004-0950-7.
[17] Wessel MM, Nair N, Aaker GD, et al. Peripheral retinal ischaemia, as evaluated by ultra-widefield fluorescein angiography, is associated with diabetic macular oedema[J]. Br J Ophthalmol, 2012, 96(5):694-698. DOI: 10.1136/bjophthalmol- 2011-300774.
[18] Patel RD, Messner LV, Teitelbaum B, et al. Characterization of ischemic index using ultra-widefield fluorescein angiography in patients with focal and diffuse recalcitrant diabetic macular edema[J]. Am J Ophthalmol, 2013, 155(6): 1038-1044. DOI: 10.1016/j.ajo.2013.01.007.
[19] Jiang JW, Yi ZH, Wang XL, et al. Quantitative analysis of retinal vasculature in normal eyes using ultra-widefield fluorescein angiography[J]. Int J Ophthalmol, 2021, 14(12):1915-1920. DOI: 10.18240/ijo.2021.12.16.
[20] Wang X, Xu A, Yi Z, et al. Observation of the far peripheral retina of normal eyes by ultra-wide field fluorescein angiography[J]. Eur J Ophthalmol, 2021, 31(3):1177-1184. DOI: 10.1177/1120672120926453.
[21] Singer M, Sagong M, van Hemert J, et al. Ultra-widefield imaging of the peripheral retinal vasculature in normal subjects[J]. Ophthalmology, 2016, 123(5):1053-1059. DOI: 10.1016/j.ophtha.2016.01.022.
[22] Silva PS, Dela Cruz AJ, Ledesma MG, et al. Diabetic retinopathy severity and. peripheral lesions are associated with nonperfusion on ultrawide field angiography[J]. Ophthalmology, 2015, 122(12):2465-2472. DOI:10.1016/j. ophtha.2015.07.034.
[23] Oliver SC, Schwartz SD. Peripheral vessel leakage (PVL): a new angiographic finding in diabetic retinopathy identified with ultra wide-field fluorescein angiography[J]. Semin Ophthalmol, 2010, 25(1-2):27-33. DOI: 10.3109/ 08820538.2010.481239.
[24] Fang M, Fan W, Shi Y, et al. Classification of regions of nonperfusion on ultra-widefield fluorescein angiography in patients with diabetic macular edema[J]. Am J Ophthalmol, 2019, 206:74-81. DOI: 10.1016/j.ajo.2019.03.030.
[25] Sim DA, Keane PA, Rajendram R, et al. Patterns of peripheral retinal and central macula ischemia in diabetic retinopathy as evaluated by ultra-widefield fluorescein angiography[J]. Am J Ophthalmol, 2014, 158(1):144-153. DOI: 10.1016/j.ajo.2014.03.009.