·Clinical Research·
Changes of macular vessel density in early primary open-angle glaucoma with central visual field and peripheral visual field defects
Huo Yanjiao, Guo Yan, Wang Huaizhou, Li Lei, Wang Ningli
Beijing Ophthalmology & Visual Science Key Laboratory, Beijing Institute of Ophthalmology, Beijing Tongren Eye Center, Beijing Tongren Hospital, Capital Medical University, Beijing 100730, China
Corresponding author: Wang Ningli, Email: wning@Htip.163.com
Abstract [View PDF in English] [View PDF in Chinese] [Read Full Text]
Objective To compare the changes of macular microvasculature in early primary open-angle glaucoma (POAG) patients with central visual field defects (CVFDs) and peripheral visual field defects (PVFDs). Methods A cross-sectional study was performed. Sixty-six eyes of 66 consecutive patients with early POAG were enrolled at the Beijing Tongren Hospital from June to December of 2020. The patients were divided into the CVFD group (25 eyes) and PVFD group (41 eyes) according to their visual field defects. Another 55 eyes of 55 age-, sex-, and spherical equivalent-matched healthy participants constituted the normal control group. All participants underwent routine ophthalmic examinations, including the Humphrey 24-2 visual field test. Macular vessel density (VD) and perfusion density (PD) of a 6 mm × 6 mm area were measured using optical coherence tomography angiography, and the area was divided into three rings and nine zones, including center, inner ring (superior, inferior, temporal, and nasal sectors), and outer ring (superior, inferior, temporal, and nasal sectors) according to the The Early Treatment of Diabetic Retinopathy Study (ETDRS) ring. The relationships among VDs, PDs, and visual field defects were analyzed. This study adhered to the Declaration of Helsinki, and the research protocol was approved by the Ethics Committee of Beijing Tongren Hospital, Capital Medical University (No. TRECKY2020-103). Written informed consent was obtained from each participant before examinations. Results The total macular VDs of the normal control, CVFD, and PVFD groups were 18.20 (17.50, 18.50), 17.10 (16.30, 17.85), and 17.20 (16.25, 17.90) mm/mm2, respectively, with significant differences (H=20.84; P<0. 001). The total macular PDs of the normal control, CVFD, and PVFD groups were 0.45 (0.43, 0.46), 0.42 (0.40, 0.44), and 0.43 (0.40, 0.44) mm2/mm2, respectively, with significant differences (H=16. 15; P≤0.001). The total macular VDs and PDs of the CVFD and PVFD groups were significantly lower than those of the normal control group (all, P<0.05). Significant differences were found for the VDs and PDs of the superior, inferior, temporal, and nasal sectors of the outer ring among the three groups (all P<0.05). The VDs of the outer ring and PDs of the superior, inferior, and nasal sectors of the outer ring were significantly reduced in the CVFD group, when compared with the normal control group (all P<0.05). The VDs and PDs of the superior, inferior, and temporal sectors of the outer ring were significantly reduced in the PVFD group, when compared with the normal control group (all P<0.05). The macular PD of the outer-nasal sector of the CVFD was found lower than that of PVFD group, but the difference was not significant (P=0.035). Conclusions The macular VD and PD were reduced in early POAG patients. Compared with POAG patients with CVFDs, the macular PD of the outer nasal sector of POAG patients with CVFDs was lower.
[Key words] Glaucoma, open-angle/diagnosis, tomography, optical coherence/angiography, visual field, macular vessel parameters
Fund program: National Natural Science Foundation of China (11571031); Beijing Municipal Administration of Hospitals Incubating Program (PX2020010)
DOI: 10.3760/cma.j.cn115989-20211103-00599
Glaucoma is characterized by the loss of retinal ganglion cells (RGCs) and their axons, which in turn leads to thinning of the peripapillary retinal nerve fiber layer (pRNFL) around the optic disc and the depression of the optic cup [1]. Clinically, elevated intraocular pressure (IOP) is considered as the main risk factor of primary open-angle glaucoma (POAG), and lowering IOP can effectively prevent the progression of visual impairment from glaucoma [2]. Although some glaucoma patients have acceptable IOP control, they still have progressive visual impairments, suggesting that non-IOP factors are also involved in the occurrence and progression of glaucoma [3-4]. A large number of RGCs are distributed within 4.5 mm from the center ring of the macular area. Studies have found that some glaucoma patients have central visual field defects (CVFDs) in early stages, which significantly affect their visual function [5-7]. Optical coherence tomography angiography (OCTA) is a widely used, vessel-based imaging technique, which can noninvasively display three-dimensional retinal vessel signals and perform quantitative analysis. In studies of glaucoma patients, it was found that their vessel densities in the macular and optic disc areas measured by OCTA were significantly lower than that of normal controls [8-11]. During the early stages of our research, we conducted OCTA scans of POAG patients with different visual field stages. The results showed that the superficial macular vessel density progressively decreased during progression of visual field impairments [12]. There are currently few reports of changes of retinal microcirculation caused by local visual field impairments. This study therefore aimed to determine the relationships between local visual field defects and macular microcirculation changes, to provide guidance for the diagnosis and follow-up of glaucoma patients.
1 Materials and Methods
1.1 General information
A cross-sectional study involved 66 eyes of 66 consecutive patients with early POAG, who were enrolled at the Beijing Tongren Hospital, Capital Medical University, from June to December of 2020. The patients were divided into a CVFD group (25 eyes) or PVFD group (41 eyes) according to their visual field defects, followed by a cross-sectional study. Sixty-six eyes of 66 consecutive patients were early POAG enrolled at the Beijing Tongren Hospital from June to December of 2020. The patients were divided into a CVFD group (25 eyes) or PVFD group (41 eyes) according to their visual field defects. Another 55 eyes of 55 healthy people were used as the normal control group. The right eyes of all normal control subjects were studied. Early POAG diagnostic criteria involved the following: (1) patients with 24 hour IOP ≥21 mmHg (1 mmHg=0.133 kPa), with secondary causes excluded; (2) patients with chamber angle openings, (3) patients with typical glaucomatous optic nerve abnormalities accompanied by changes in the visual field, such as diffuse or localized defects along the optic disc; hemorrhage along the optic disc, or enlargement of the diameter ratio of the optic cup and the optic disc, as well as pRNFL defects corresponding to areas analyzed by slit lamp microscopy combined with preset lens examinations or fundus color photography; and (4) patients with a mean deviation (MD) >-6 dB [13]. Inclusion criteria for patients with early POAG included the following: (1) patients met the diagnostic criteria for early POAG, and (2) patients showed good compliance and they were able to cooperate with examinations and follow-ups. Exclusion criteria included the following: (1) best-corrected visual acuity <0.1; (2) a history of eye surgery during the previous 6 months; (3) patients with refractive interstitial opacities that interfered with fundus imaging and OCT/OCTA imaging; and (4) patients whose intensities of acquired signals were less than 8. Inclusion criteria of the normal control group included the following: (1) IOP <21 mmHg; (2) optic nerve with a normal appearance and without a pRNFL defect; (3) the glaucoma hemi-visual field examination was normal in the visual field examination; and (4) mean deviation (MD) and pattern standard deviation (PSD) were in the normal range. All the participants had a best-corrected visual acuity ≤0.1, spherical equivalent (SE) from -6.00 to +6.00 diopters (D), no macular disease and other systemic disease affecting the visual acuity and visual field, and no systemic drugs that might cause changes in the ocular vessels (such as hypotensive drugs and hypolycemic and antilipemic agents). All participants were screened by two physicians, who were glaucoma specialists. The participants were assigned to groups according to the agreement of the two physicians, and were excluded from the study when the two physicians disagreed. There was no significant difference in age, sex composition ratio, SE, or central corneal thickness among the three groups (all, P>0.05) (Table 1). This study adhered to the Declaration of Helsinki, and the research protocol was approved by an Ethics Committee of Beijing Tongren Hospital, Capital Medical University (No. TRECKY2020-103). Written informed consent was obtained from each participant before any examination.

1.2 Methods
1.2.1 General Examination. All eyes examined were subjected to a systematic ophthalmic examination. A fully automatic computer vision meter (MC-3; Topcon, Tokyo, Japan) was used to measure visual acuity. The diopter value (D) of the tested eye was measured using a computer auto-optometry instrument (Canon, Tokyo, Japan). The IOP was measured using a noncontact tonometer (Canon). The anterior segment was examined using a slit lamp microscope (BM900; Haag-Streit, Koniz, Switzerland). The fundus was examined using a slit lamp microscope combined with a preset lens (90D; Volk Optical, Mentor, OH, USA). Fundus photography was performed using a color fundus camera (Kowa, Tokyo, Japan). The anterior segment module of a Cirrus OCT instrument was used to measure the corneal thickness of the eyes. Refractive diopters and IOP were measured on the same day as the OCTA examination, with three measurements for each parameter, followed by calculation of the average using the formula: SE=spherical equivalent + 1/2 cylindrical equivalent.
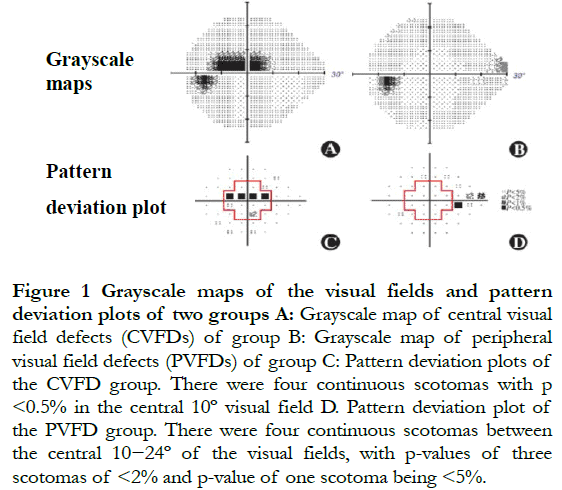
1.2.2 Visual field measurements. The participant was asked to place the lower jaw into the holder, then to stare at the cursor. The visual field examination was conducted using an HFA-860 visual field meter (Carl Zeiss, Jena, Germany) using the SITA 24-2 mode. The changes in the visual fields of glaucoma patients were defined as the following: (1) the results of the half visual field examination of glaucoma patients was outside the normal range, and (2) three or more consecutive scotomas with P<5% or two or more consecutive scotomas with P<2%. Visual field defects were confirmed using two consecutive and credible examinations. The index of credibility required a false positive <15%, false negative <15%, and fixation loss <20%. The CVFDs were defined as three or more consecutive scotomas with P<5% or two or more consecutive scotomas with P<2% in the central 10º visual field from the pattern deviation plot. PVFDs were defined as three or more scotomas with P<5% or two or more scotomas with P<2% between the central 10−24º of the visual field (Figure 1)[14].
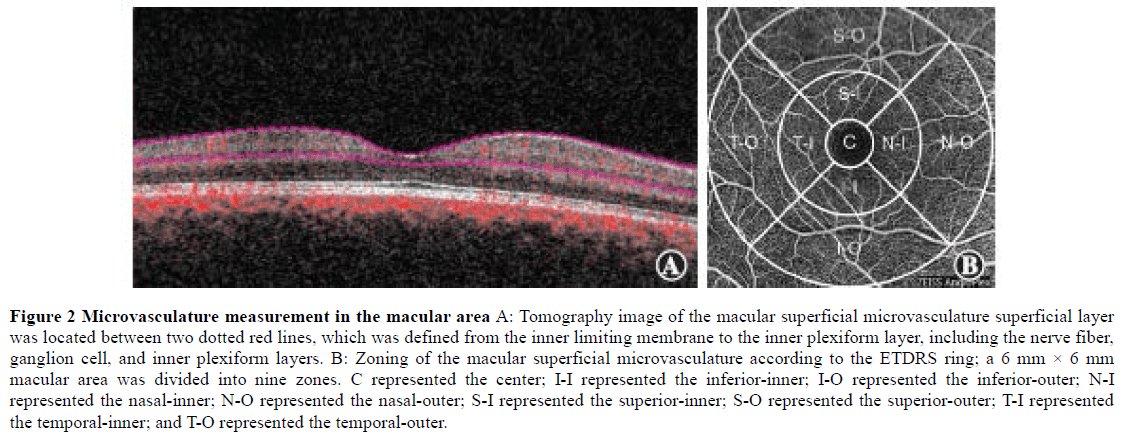
1.2.3 OCTA and OCT examinations. The tomography image of the superficial macular retinal vessel was obtained using a Cirrus 5000 OCTA (Zeiss) at a wavelength of 840 nm, a scanning speed of 68,000 A/s, and a scanning range of 6 mm × 6 mm in the macular area. According to the ETDRS ring, a 6 mm × 6 mm macular area was divided into three rings and nine zones, which were the center, inner (superior, inferior, temporal, and nasal), and outer (superior, inferior, temporal, and nasal) rings. The VD and PD of the superficial retina were obtained in these nine zones (Figure 2). VD was defined as the total length of perfusion vessels per unit area of the retina; perfusion density was defined as the total perfusion vessel area per unit area of the retina. There were 245 A-scans in the B-scans of the horizontal and vertical scan lines. The superficial macular retinal layer was defined from the inner limiting membrane to the inner plexiform layer, including the retinal nerve fiber layer, RGC, and inner plexiform layer[15]. The Grrns OCT-affiliated software (AngioPlex, software, version 10.0) was used for quantitative analysis of all scans. At the same time, the thickness of the macular ganglion cell-inner plexiform layer (mGCIPL) was determined. All OCT and OCTA scans were conducted by the same experienced technician using the same instruments. All scanned images were evaluated for quality, to eliminate fixation losses, layering errors, and motion artifacts.
1.3 Statistical methods
SPSS 23.0 statistical software for Windows (SPSS, Chicago, IL, USA) was used for statistical analysis. The Shapiro-Wilk test was used to confirm whether the measurement data were normally distributed. The data that conformed to the normal distribution are expressed as ±s, and the Le/ne test was used to test the homogeneity of variance of the standard deviations between groups. Non-normal distribution data are expressed as M (Q1, Q3); count data are expressed as the number of cases and percentages. The overall difference of evaluation indexes for normal distribution data among the three groups was compared using one-way analysis of variance, and the test level was a = 0.05. The Bonferroni test was used for pairwise comparisons, with a=0.05/3=0.017. The overall difference of skewed distribution data among the three groups was compared using the Kruskal-Wallis H test, and pairwise comparison was performed using the Wilcoxon rank-sum test. The sex composition ratio of each group was compared using the V test. An independent sample t-test was used to compare quantitative differences in the amounts of ocular hypotensive agents used in the eyes of the CVFD and PVFDs groups. A value of p < 0.05 indicated that the difference was statistically significant.
2 Results
2.1 Vessel density comparisons among the three groups in the macular superficial layer
The total macular VD of the normal control, CVFD, and PVFD groups were 18.20 (17.50, 18.50), 17.10 (16.30, 17.85), and 17.20 (16.25, 17.90) mm/mm2, respectively, with significant differences (H=20.84; P<0. 001). The total macular VD of the CVFD and PVFD groups were significantly lower than that of the normal control group (all, P<0.05). There was no significant difference between the VDs of the CVFD and PVFD groups.
There was no significant difference in the VDs of the center and inner rings (superior, inferior, temporal, and nasal) in the eyes of the normal control, CVFD, and PVFD groups (H=2.89, 3.40, 4.23, 1.58, 5.03; all P>0.05). The overall differences in VDs of the outer ring (superior, inferior, temporal, and nasal) among the three groups were statistically significant (H=15.81, 30.73, 12.44, 13.35; all, P<0.01). Compared with the normal control group, the VDs in all areas of the outer ring of eyes in the CVFD group significantly decreased, and those in the outer ring (superior, inferior, and temporal) in the PVFDs group significantly decreased (all P<0.05) (Table 2).

2.2 Perfusion density comparisons of the macular superficial layers among the three groups
The total macular PD of the normal control, CVFD, and PVFD groups were 0.45 (0.43, 0.46), 0.42 (0.40, 0.44), and 0.43 (0.40, 0.44) mm2/mm2, respectively, with significant differences (H=16.15; P<0.001). The total macular PDs of the CVFD and PVFD groups were significantly lower than those of the normal control group (P=0.002, 0.003, respectively). There was no significant difference between the PDs of the CVFD group and those of the PVFD group (P=1.000).
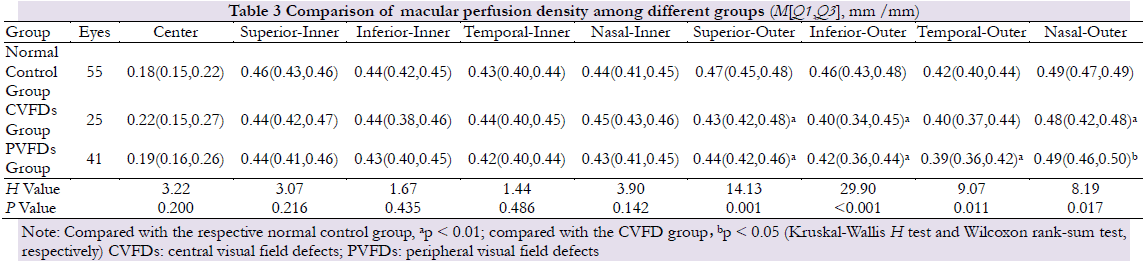
There were no significant differences in the PD of the center and inner rings (superior, inferior, temporal, nasal) in the macular area in the eyes of the normal control, CVFD, and PVFD groups (H=3.22, 3.07, 1.67, 1.4, 3.90; all P>0. 05). The overall differences in PDs of the outer ring (superior, inferior, temporal, and nasal) among the three groups were statistically significant (H=14.13, 29.90, 9.07, 8.19; all P<0.05). Compared with the normal control group, the PDs in the outer ring (superior, inferior, and nasal) of the detected eye in the CVFDs group were significantly decreased, and that in the outer ring (superior, inferior, and temporal) in the PVFDs group were also significantly reduced (all P<0.05). The PD in the outer ring (nasal) in CVFDs group was lowered in comparison with CVFDs group, but the difference was not statistically significant (P=0.035) (Table 3).
3 Discussion
This study found that in patients with early POAG, the macular vessel parameters were significantly decreased, when compared with the normal control group, regardless of the presence of macular visual field defects. Studies in China and abroad have reported that patients with early glaucoma experienced a significant decrease in macular VD, and that these vessel changes were significantly correlated with measurement parameters of visual field sensitivity or macular structure [16–20]. However, these studies focused on the average sensitivity of the overall visual field, and there was a lack of studies on microcirculation changes of local visual field defects. Recent studies have measured the vessels near the optic disc and in the macula area in patients with POAG, accompanied by hemi-visual field defects. It was found that the VDs near the optic disc and in the macular superficial layer, and the thicknesses of the pRNFL and macular inner layer corresponding to the normal hemi-visual field, were significantly decreased, when compared with the normal control group. However, there was no significant difference in the visual field MD values between the CVFD and PVFD groups [21]. This study also found that in patients with early POAG without macular visual field defects, the macular vessel parameters significantly decreased, when compared with that of the normal control group, which mainly occurred in 3~6 mm of the outer ring. Xiaolei et al. [21] reported a study using patients with progressive POAG, with an average MD value of -15.36 dB, while all participants had a MD > -6 dB, suggesting that the decrease in measured values of local retinal vessel parameters might have occurred before changes of the visual field. In this study, the mGCIPL thicknesses of patients with POAG accompanied by CVFDs significantly decreased, when compared with POAG patients with PVFDs, suggesting that there was significant interaction between the superficial macular vessel and the structure and function of the macular inner layer. Hou et al. [22] followed-up POAG patients for 2.6 years and found that the macular vessel density decreased faster than the thinning rate of the macular inner layer thickness, and that this process was significantly correlated with the severity of the disease. The results of the above studies have therefore suggested that a decrease in local vessel parameter measurements may be a potential indicator for early detection of visual field defects and macular structural changes, and it is therefore recommended that retinal vessel monitoring be conducted during glaucoma screening to detect glaucoma optic nerve changes as early as possible.
The present study found no significant difference between the CVF and PVF groups in macular (inner ring) vessel parameters of POAG patients. Furthermore, the measured values of vessel parameters of the macular nasal-outer layer of the CVF group were significantly lower than those of the PVF group. The results might be related to the course of retinal nerve fibers. Hood et al.[23] reported the corresponding relationship between Humphrey’s visual field and the retinal nerve fiber layer. The retinal nerve fibers were roughly divided into nerve fibers of the discmacular tract, superior and inferior arc-shaped nerve fibers, and nasal radial nerve fibers. The nerve fibers of the discmacular tract originate from the macular area and enter the temporal side of the optic disc, directly in a straight line. The superior and inferior arc-shaped nerve fibers originate from the temporal side, superior area, and inferior area of the macula. The nerve fibers on the temporal side of the macula must therefore bypass the nerve fibers of the discmacular tract and enter the temporal side of the optic disc from the superior and inferior areas, respectively, of the temporal side of the optic disc in an arc shape. The nerve fiber defects in the macular area, nasal side of the macula, temporal side of the optic disc, and the corresponding vessel changes therefore occurred in patients with CVFDs. Patients with PVFDs were more likely to have nerve fiber defects and corresponding vessel changes in the superior and inferior areas of the macula and the upper and lower directions of the optic disc. The macular ETDRS ring used in this study could detect vessel changes in the 6 mm × 6 mm area of the macula area, but detection of vessels in a wider area require further enhancements of the OCTA instrument software, to detect retinal vessel changes in patients with PVFDs.
The retinal vessels originated from the optic disc and presented the course of supratemporal, infratemporal, supranasal and infranasal passages, reaching the macula and distributed as upper and lower arches, encircling the avascular area of the macula. Early glaucoma often starts in one area or quadrant, and the measurement of its visual field and structure are characterized by up-down asymmetry. Therefore, the asymmetry of vessel is more easily detected by using the ETDRS ring. Lu et al. [24] found there was no statistically significant difference in vessel density on the nasal (inner and outer rings) and temporal sides (inner and outer rings) in patients with and without CVFDs accompanied by early POAG. However, the differences in vessel densities between the upper quadrants of the outer ring and lower quadrants of the outer ring were statistically significant, which differed from the results of the present study. Lu et al. [24] used the 10-2 visual field mode to determine whether there were CVFDs. The 24-2 mode was used in this study. This study was used to determine whether there were local scotomas in the 10-2 mode in patients without CVFDs, so it was speculated that different grouping modes were the reason for the differences in study results. It has been found that the 10-2 visual field mode was more likely to improve the sensitivity of CVFDs screening, and therefore may have a better correlation with macular measurement parameters [25]. However, the more widely used mode in clinical practice is 24-2 or 30-2. In the future, the comprehensive evaluation of macular visual field defects by combining 24-2 and 10-2 should be considered.
There were some limitations in this study. (1) Although it was speculated that visual field impairment occurred only after the vessel parameters decreased, longitudinal studies are still needed to confirm the sequential relationship between the changes of macular structure, vessel, and functions. (2) The best-corrected visual acuity among the three groups was not measured and compared in this study, and the difference in visual acuity of glaucoma patients with or without macular visual field defects needs further investigation. (3) The sample size of CVFDs in this study was limited, which was mainly due to the fact that few patients with early POAG had CVFDs, and it was necessary to match sex, age, and degree of glaucoma with PVFDs to avoid the influence of confounding factors on the macular vessel. In addition, some studies have found that the superficial macular vessel density of patients with high myopia was reduced [26]. All participants in this study had medium and low myopia, and there was no statistically significant difference in SE among the three groups, so the influence of confounding factors on the results was reduced as much as possible. (4) This study did not characterize the thickness and vessel parameter distributions measured by mGCIPL. The main reason was that the scanning mode and subarea of the Crms OCTA in the macular area were different from that of the mGCIPL, so they did not correspond with each other. It is hoped that in the future, OCTA software can match the scanning mode of the mGCIPL, so that we can better study the relationships between thickness and vessel parameter distributions.
In summary, OCTA was used to show that vessel and perfusion densities in macular areas of patients with early POAG were significantly reduced. For the patients with early POAG who had CVFDs, the perfusion density on the nasal side in the outer ring of the macular area was lower than that of PVFDs, suggesting that a decrease in the superficial retinal blood supply in the macular area occurred before the decrease in central visual function. Furthermore, the decrease in the nasal blood supply might suggest the loss of central visual field function.
Conflict of Interest. All authors declare that there is no conflict of interest.
Author contribution statement. Wang Ningli participated in topic selection and research design, research process guidance, data and materials analysis, main content modification, and finalization of the article. Huo Yanjiao participated in the research design and test implementation, data collection and analysis, writing of the manuscript, manuscript modification, and manuscript finalization. Guo Yan participated in research implementation, data collection and analysis, and manuscript revision. Wang Huaizhou participated in experimental guidance, reviewed the informative content of the manuscript, and revised and finalized the intellectual content. Li Lei participated in the collection and statistical analysis of experimental data.
References
[1]Glaucoma Group of Chinese Ophthalmological Society of Chinese Medical Association, Glaucoma Group of Chinese Ophthalmologist Society of Chinese Medical Association. Chinese Glaucoma Guideline (2020)[J]. Chinese Journal of Ophthalmology, 2020, 56(8):573-586. DOS10.3760/cma.j.cn 112142-20200313-00182.
[2]The AGIS Investigators. The Advanced Glaucoma Intervention Study (AGIS):7. The relationship between control of intraocular pressure and visual field deterioration[J]. Am J Ophthalmol, 2000, 130(4):429-440. DOI: 10.1016/s0002- 9394(00)00538-9.
[3]Grunwald JE, Piltz J, Hariprasad SM, et al. Optic nerve and choroidal circulation in glaucoma[J] .Invest Ophthalmol Vis Sci, 1998, 39(12):2329-2336.
[4]Galassi F,Sodi A,Ucci F,et al. Ocular hemodynamics and glaucoma prognosis: a color Doppler imaging study[J]. Arch Ophthalmol, 2003, 121(12):1711-1715. DOI: 10.1001/archopht.121.12.1711.
[5]Burr JM, Kilonzo M, Vale L, et al. Developing a preference-based Glaucoma Utility Index using a discrete choice experiment[J]. Optom Vis Sci, 2007, 84(8):797-808. DOI:10.1097/OPX.0b013e3181339f30.
[6]Aspinall PA, Johnson ZK, Azuara-Blanco A, et al. Evaluation of quality of life and priorities of patients with glaucoma [J] . Invest Ophthalmol Vis Sci, 2008, 49(5):1907-1915. DOI: 10. 167/iovs.07-0559.
[7]Na JH, Kook MS, Lee Y, et al. Structure-function relationship of the macular visual field sensitivity and the ganglion cell complex thickness in glaucoma[J]. Invest Ophthalmol Vis Sci, 2012, 53 (8):5044-5051. DOI: 10.1167/iovs.11-9401.
[8]Wang X, Jiang C, Ko T, et al. Correlation between optic disc perfusion and glaucomatous severity in patients with open-angle glaucoma: an optical coherence tomography angiography study[J]. Graefe’s Arch Clin Exp Ophthalmol, 2015, 253(9):1557-1564. DOI: 10.1007/s00417-015-3095-y.
[9]Yarmohammadi A, Zangwill LM, Diniz-Filho A, et al. Relationship between optical coherence tomography angiography vessel density and severity of visual field loss in glaucoma[J]. Ophthalmology, 2016, 123(12):2498-2508. DOI: 10. 1016/j.ophtha.2016.08.041.
[10]Chen HS, Liu CH, Wu WC, et al. Optical coherence tomography angiography of the superficial microvasculature in the macular and peripapillary areas in glaucomatous and healthy eyes[J]. Invest Ophthalmol Vis Sci, 2017, 58(9):3637-3645. DOI: 10.1167/iovs.17-21846.
[11]Chen XL, Jiao Y, He WS, et al. Retinal vessel density and retinal thickness as measured using optical coherence tomography angiography in open angle glaucoma[J]. Chin J Exp Ophthalmol, 2020, 38(5):396-401. DOI: 10. 3760/cma.j.cn115989-20200326-00208.
[12]Huo Y, Thomas R, Guo Y, et al. Superficial macular vessel density in eyes with mild,moderate,and severe primary open-angle glaucoma[J]. Graefe’s Arch Clin Exp Ophthalmol, 2021, 259(7):1955-1963. DOI: 10.1007/s00417-021-05120-4.
[13]Zhao C, Yuan YS, Zhong H. Staging visual field impairment in glaucoma[J]. Chin J Exp Ophthalmol, 2013, 31(3):292-297. DOI: 10.3760/cma.j.issn.2095- 0160.2013.03.020.
[14]Kwon J, Choi J, Shin JW, et al. Alterations of the foveal avascular zone measured by optical coherence tomography angiography in glaucoma patients with central visual field defects[J]. Invest Ophthalmol Vis Sci, 2017, 58(3):1637-1645. DOI: 10.1167/iovs.16-21079.
[15]Rosenfeld PJ, Durbin MK, Roisman L, et al. ZEISS angioplex™ spectral domain optical coherence tomography angiography : technical aspects[J]. Dev Ophthalmol, 2016, 56:18-29. DOI: 10.1159/000442773.
[16]Rao HL, Pradhan ZS, Suh MH, et al. Optical coherence tomography angiography in glaucoma[J]. J Glaucoma, 2020, 29(4):312-321. DOI: 10.1097/IJG.0000000000001463.
[17]Richter GM, Madi I, Chu Z, et al. Structural and functional associations of macular microcirculation in the ganglion cell-inner plexiform layer in glaucoma using optical coherence tomography angiography[J]. J Glaucoma, 2018, 27(3):281-290. DOI: 10.1097/IJG.0000000000000888.
[18]Bojikian KD, Nobrega P, Wen JC, et al. Macular vascular microcirculation in eyes with open-angle glaucoma using different visual field severity classification systems[J]. J Glaucoma, 2019, 28(9):790-796. DOI: 10.1097/IJG. 0000000000001308.
[19]Lommatzsch C, Rothaus K, Koch JM, et al. OCTA vessel density changes in the macular zone in glaucomatous eyes [J]. Graefe’s Arch Clin Exp Ophthalmol, 2018, 256(8):1499 – 1508. DOI: 10.1007/s00417-018-3965-1.
[20]Yan YJ, Sun XQ, Chen S, et al. Evaluation of macular ganglion cell complex and peripheral retinal nerve fiber layer structural impairment in early primary glaucomous eyes by 3D-OCT [J] . Chin J Exp Ophthalmol, 2016, 34(8):739-743. DOI: 10. 3760/cma.j.issn.20950160.2016.08.016.
[21]Wang XL, Sun XH. Retinal vessel density in primary open-angle glaucoma with a hemifield defect[J]. Chin J Ophthalmol, 2021, 57(3):201-206. DOI: 10. 3760/cma.j.cn112142-20201102-00734.
[22]Hou H, Moghimi S, Proudfoot JA, et al. Ganglion cell complex thickness and macular vessel density loss in primary open-angle glaucoma [J]. Ophthalmology, 2020, 127(8):1043-1052. DOI: 10. 1016/j.ophtha.2019.12.030.
[23]Hood DC, Kardon RH. A framework for comparing structural and functional measures of glaucomatous impairment[J]. Prog Retin Eye Res, 2007, 26(6):688-710. DOI: 10.1016/j.preteyeres.2007.08.001.
[24]Lu P, Xiao H, Chen H, et al. Asymmetry of macular vessel density in bilateral early open-angle glaucoma with unilateral central 10-2 visual field loss[J]. J Glaucoma, 2020, 29(10):926-931. DOI: 10. 1097/IJG.0000000000001578.
[25]Park SC, Kung Y, Su D, et al. Parafoveal scotoma progression in glaucoma: humphrey 1 0-2 versus 24-2 visual field analysis[J]. Ophthalmology, 2013, 120(8):1546-1550. DOI: 10.1016/j.ophtha.2013.01.045.
[26]Milani P, Montesano G, Rossetti L, et al. Vessel density, retinal thickness, and choriocapillaris vascular flow in myopic eyes on OCT angiography[J]. Graefe’s Arch Clin Exp Ophthalmol, 2018, 256(8):1419-1427. DOI: 10. 1007/s00417-018-4012-y.