•Clinical Research•
Improvement of the visual acuity assessment system in deaf-mute children
Jonnazarov Eldor I.1,3,4, Avetisov Sergey E.1,2, Cervatiuc Maria I.1
1Sechenov First Moscow State Medical University (Sechenov University), Moscow, 119991, Russia;2Research Institute of Eye Diseases, Moscow, 119991, Russia; 3Khatlon State Medical University, Dangara, 735320, Tajikistan; 4Avicenna Tajik State Medical University, Dushanbe, 734003, Tajikistan
Corresponding author: Jonnazarov Eldor, Email: professor.eldor@gmail.com
[Abstract] [View PDF] [Read Full Text]
Objective To improve the visual acuity assessment system in deaf-mute children based on an original and fundamentally new chart for visometry. Methods The study included 31 deaf-mute children (62 eyes) without previously diagnosed ocular pathology at the age of 2-11 years. Visometry was performed using standard Golovin–Sivtsev table (Russian: Таблица Головина-Сивцева) and a fundamentally new original technique Just Evident Images/Jonnazarov Eldor Ikhtiyorovich (abbreviated as JEI/JEI), including cards duplicating optotypes. The set of optotypes in the JEI/JEI chart consists of 13 color and black optotypes of various sizes, equal in width and height, which reflect well-known and easily recognized objects by children even at an early age. Results When the results of visometry according to the Golovin chart and using the original technique coincided, which occurred in 16 (51.6%) and 13 (41.9%) cases, respectively, when determining the visual acuity of the right and left eyes, respectively, the effectiveness of both methods was evaluated as identical. In 15 (48.4%) and 18 (58.1%) cases, when examining the right eye and the left eye, respectively, the visometry data differed with a homogeneous trend: the indicator obtained using the JEI/JEI charts exceeded the same indicator when using the Golovin charts in the range of 0.1 – 0.4; and in the group of children aged 2-5 years – 0.2 – 0.4. Conclusions The results obtained indicate the prospects of using the JEI/JEI chart for visometry in deaf-mute children in clinical practice. The developed technique of duplicating optotypes with the help of special cards simplifies and enhances the effectiveness of visometry.
[Key words] Visual acuity; Visometry in deaf-mute children; Charts for visometry; A set of optotypes
DOI: 10.3760/cma.j.cn115989-20220512-00212
According to the World Health Organization, the problem of hearing impairment affects about 650 million people — this is every ninth inhabitant of the planet, more than half of them suffer from disabling hearing loss. More than 13 million people with hearing impairment live in Russia, including more than 1 million children [1]. In the study of patients with hearing impairments, visual defects were found in more than a quarter of cases, in the structure of which various refractive errors prevailed [2-9]. Vision plays a central role in the development of newborns and children, and early and visual disorders can affect the formation of motor skills, cognitive functions, social and communicative abilities and the formation of social relationships [10]. It should be noted that when assessing visual functions in children, one of the main diagnostic indicators is the acuity of central vision. The subjective component, which presupposes the verbal participation of children in the assessment of optotypes, complicates the assessment of visual acuity in deaf-mute children.
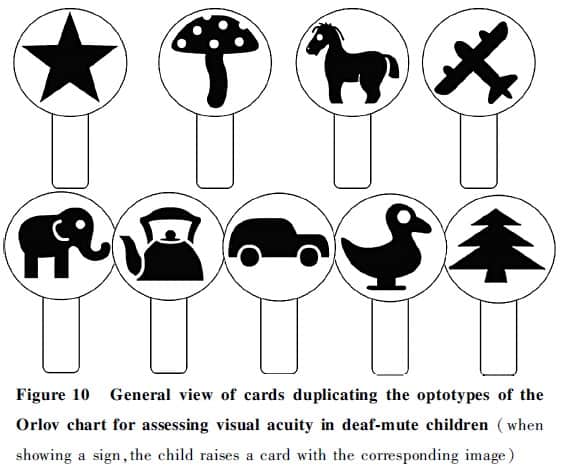
As is known, the world standard for determining visual acuity in preschool children is the Lea chart. On the territory of the Russian Federation and other post-Soviet countries, it is customary to use the Orlova chart for visometry in children of this age group, which is essentially an analogue of the Lea chart. The Orlova chart is a single sheet of paper with a 580× 520 cm format, which depicts optotypes (drawings) of various sizes in the form of a star, mushroom, Christmas tree, circle, chicken, car, horse, airplane, elephant, motorcycle. . The optotypes are grouped into two sheets: there are 5 rows in the left, and 7 in the right. The optotypes in the rows from top to bottom gradually decrease in size. Visual acuity is marked opposite each row: in the left column from 0.1 to 0.3, in the right column from 0.4 to 1.0. With a visual acuity of 0.1-0.2, there are three optotypes in each row, at 0.3 – four optotypes, at 0.4-0.5 – five, at 0.6-0.7 – six, at 0.8-0.9 – seven, at 1.0 – eight. The background of the chart is white, and the letters are black (Figure 1) [11-16].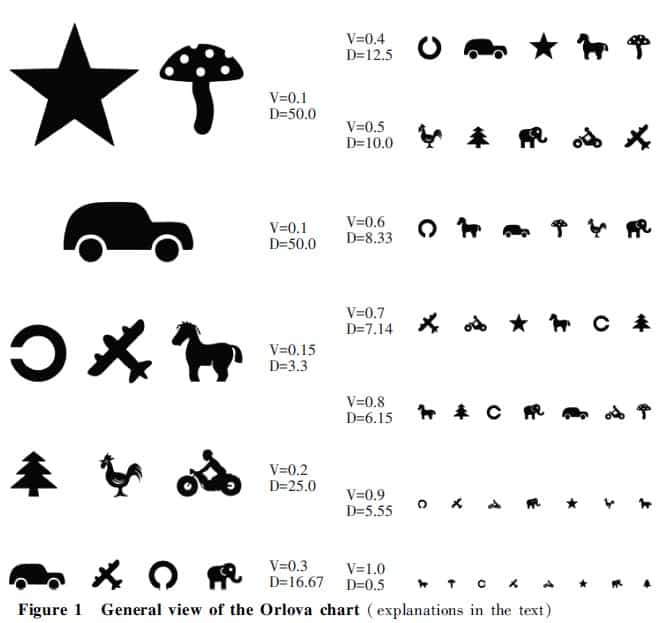
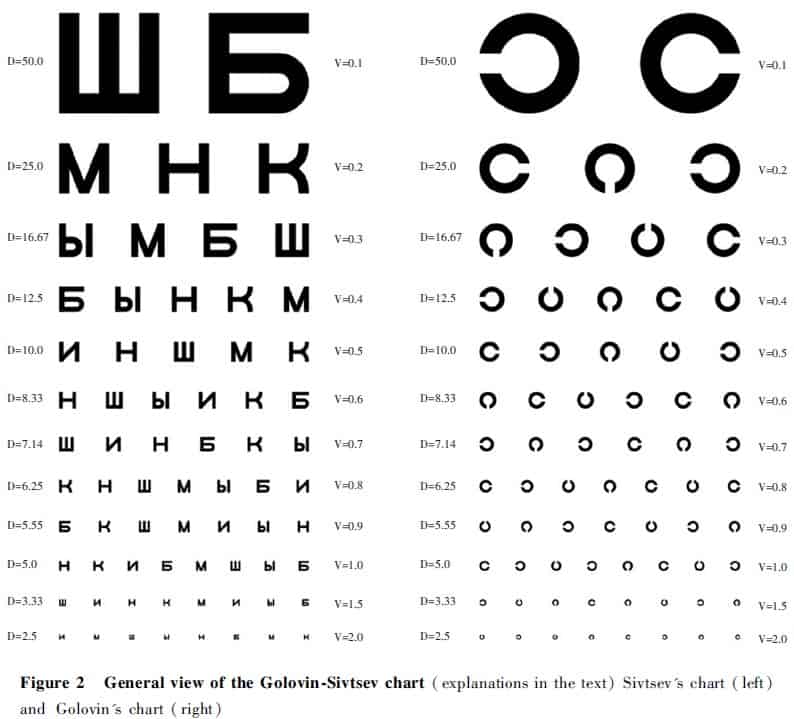
The most common method of visometry in patients with hearing impairments and the mute remains a study using the Golovin diagram (Figure 2), which shows Landolt rings with breaks directed up, down, left or right. On the territory of the Russian Federation and other post-Soviet countries, various methods are used for this: printed Golovin–Sivtsev chart, transparent devices and projectors. The Golovin–Sivtsev chart (Russian: Таблица Головина-Сивцева) is a standardized chart for testing visual acuity, which was developed in 1923 by Soviet ophthalmologists Sergei Golovin and D. A. Sivtsev. In the Union of Soviet Socialist Republics, it was the most common chart of its kind, and as of 2022 its use is still widespread in several post-Soviet states. The chart consists of two parts with 12 rows each, representing visual acuity values between 0.1 and 2.0. The left part consists of series of the Cyrillic letters Ш, Б, М, Н, К, Ы, and И in a definite order, and the right part of the chart consists of a series of Landolt C symbols. The width of each character is equal to its height, and the contours have standard 1⁄5 gaps of the overall size. The value D, indicated to the left of each row, gives the distance in meters from which a person with a visual acuity of 1.0 can read the corresponding row. The value V, indicated to the right, gives the minimum visual acuity needed to read the row from a distance of 5 meters. The first row contains symbols 70 mm in size (V = 0.1); the second row, 35 mm; the bottom third row, 7 mm (V = 1.0); the bottom row, 3.5 mm (V = 2.0). Black and white pattern identification at 1 arcminute angle is considered to be visual acuity of 1.0, which is around 1 mm per 3.44 m distance. A character 7 mm in size has 1.4 mm pattern gaps, so over the 5 m view distance it gives an angle of around 1 arcminute (atan(0.007/5/5)≈0.963′) (Figure 2) [17-18].
Our own clinical experience testifies to certain disadvantages of visometry according to the Golovin chart in children, due to the difficulty of correctly assessing the orientation of Landolt rings due to insufficient development of left-right orientation.
1 Materials and Methods
1.1 Participants
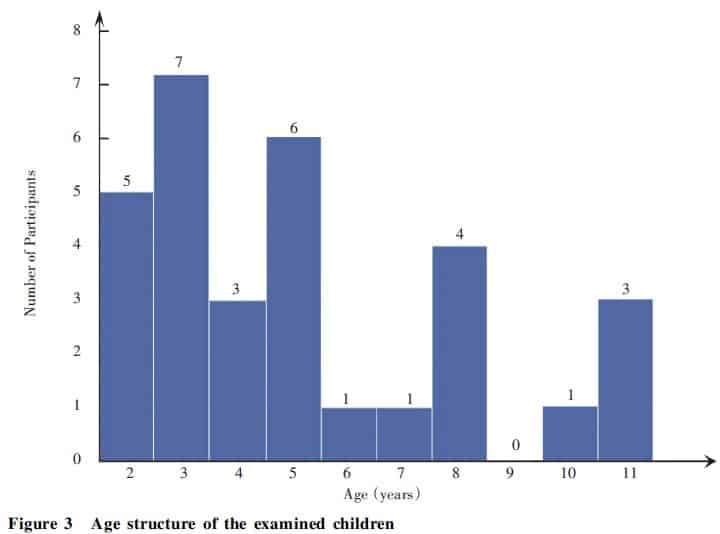
The study included 31 deaf-mute children (62 eyes) aged 2-11 years without previously diagnosed or identified eye pathology during examination (Figure 3). The study was conducted in accordance with the principles of the Helsinki Declaration. Parents signed a written informed consent to include their child in the study after explaining the purpose of the study and information about any risks and potential discomfort that may arise during the examination.
1.2 Visometry
Visometry was performed using a standard Golovin chart and a fundamentally new original technique Just Evident Images/Jonnazarov Eldor Ikhtiyorovich (abbreviated JEI/JEI) for deaf-mute children (RF patent RU 2,703,697 C1 dated September 03, 2018) [19]. At the same time, the “tabular” level of visual acuity of the right and left eyes obtained using each of the methods was compared.
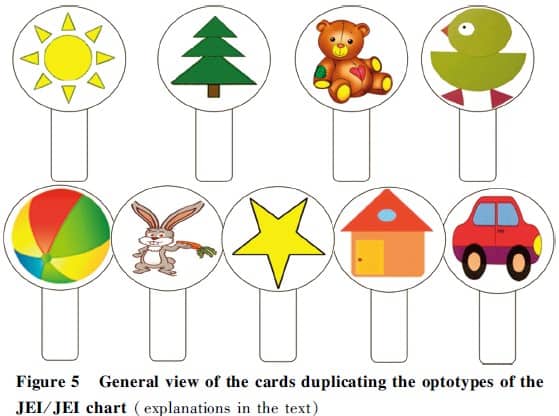
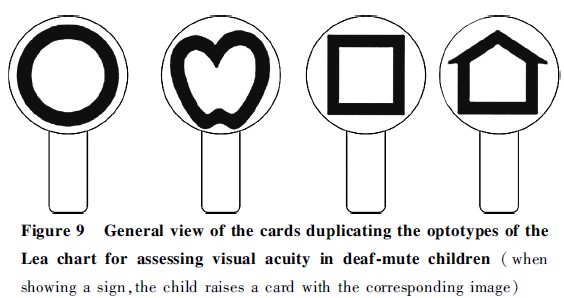
The set of optotypes in the JEI/JEI chart consists of 13 color and black optotypes of various sizes, equal in width and height, which reflect well-known and easily recognized objects by children even at an early age: “Sun”, “Flower”, “Christmas Tree”, “House”, “Chicken”, “Child”, “Star”, “Horse”, “Bear”, “Car”, “Kitten”, “Ball”, “Hare”. The study is carried out from a distance of 2.5 m from the chart, which consists of 2 A4 sheets, on which there are 10 rows of optotypes with decreasing (from 35 to 3.5 mm) dimensions and an indication of the corresponding visual acuity. On the first sheet of the chart there are three rows of optotypes corresponding to visual acuity from 0.1 to 0.3 in 0.1 increments, and on the second – seven rows corresponding to visual acuity from 0.4 to 1.0 in 0.1 increments. The distance between the signs in a row and between the rows from top to bottom increases, in the 10th row the number of optotypes decreases to 3 (Figure 4) [19-20]. During the study, the child must choose a card with the image of a sign corresponding to the presented optotype of the test chart (Figure 5).

To implement the method, you need: a chair, a chart of JEI/JEI which consists of 2 A4 sheets, a pointer, plates made of plastic, metal or cardboard (for closing one eye). For deaf-mute children: cards with the image of the signs of the test chart (when showing a sign, the child must raise the card with the corresponding image) [19-20].
In the aspect of compliance of the test with the psychophysical foundations of solving visual problems, the study of visual acuity in deaf-mute children is as follows. Before starting the visual acuity test, the child is shown a chart from a distance of 30-40 cm to familiarize him/her with the presented figure (optotype). The child is seated at a distance of 2.5 m from the chart JEI/JEI (Figure 4). The chart consists of 10 rows of pictures, the size of which is reduced from top to bottom. The left column indicates the distance from which a healthy child should see this or that row. It is indicated by the letter D (distance) and expressed in meters. Visual acuity is indicated on the right side of the chart, which is indicated by the letter V (visus). Being at a distance of 2.5 meters from the JEI/JEI chart, the child should clearly distinguish the 10th row. In this case, his visual acuity is 1.0 or 100%. If from a five-meter distance the child distinguishes only the first line, then the result is 0.1 or 10%. Further incrementally. The JEI/JEI chart is located on two A4 sheets (Figure 4). Vision is considered normal if the child is able to recognize 6-10 lines of pictures with each eye from a distance of 2.5 meters [19-20].
The study assumes compliance with the following basic conditions:
-The height and width of each image in the chart JEI/JEI should be equal (Figure 4), on the first line = 35 mm, on the second = 17.5 mm, on the tenth = 3.5 mm.
-The bottom edge of the chart should be at a distance of 60 cm from the floor level. The JEI/JEI chart is placed at the child’s eye level in a vertical plane so that the middle row of chart signs is approximately at the child’s eye level.
-The child should sit straight, calmly, without squinting and not bending forward to the chart JEI/JEI, which is located at the level of his eyes in a vertical plane so that the middle row of chart signs is approximately at the level of the child’s eyes. Deaf and dumb children should be given cards with images of optotypes from the JEI /JEI chart (Figure 5). When demonstrating a sign, the child raises a card with the corresponding image.
Vision testing in children can cause fatigue earlier than in adults, therefore it has the following features:
-first determine the visual acuity of the best eye, then the worst eye (if it is known in advance). Otherwise, the visual acuity of the right eye is first determined, then the left eye;
-the child needs to show pictures alternately, starting from the top row and gradually going down;
-if a child has shown a symbol incorrectly in any line, you should give him a second attempt;
-if he/she cannot show it, on the second attempt, it is necessary to return to the line up;
-the result is evaluated according to the line on which the child correctly showed all the images (only one error is allowed with subsequent correction);
-during the test, it is important to make sure that the child does not squint and ponder over the answer for no more than 5-10 seconds;
-next, close the second eye and repeat the same procedure.
The formula is used for visual acuity below 0.1 and above 1.0 [19]. V2=(d×V1)/D. V(visus)1 – normal visual acuity, D(distance)- the distance from which a child with normal vision sees and distinguishes images. d(distance)- the distance from which the examined child sees ,V (visus )2 – visual acuity of the tested patient.
2 Results
The results of the conducted studies are presented in the form of diagrams, in which the cases of coincidence of the results of visometry according to the charts used are indicated by black dots, and discrepancies are indicated by green and red dots, which correspond to the data obtained from the charts of JEI/JEI and Golovin, respectively (Figure 6,7).
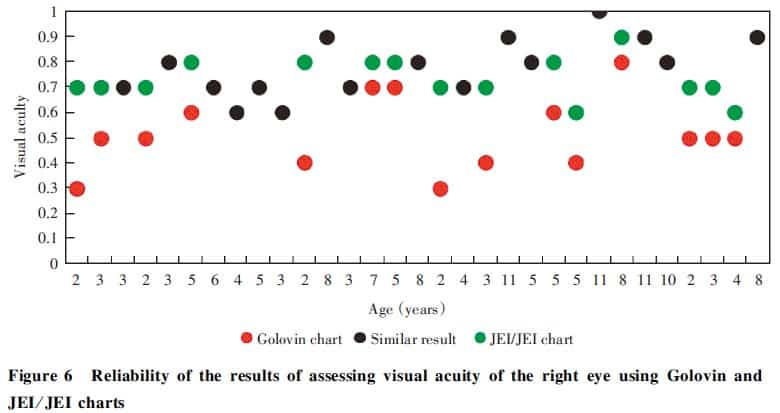
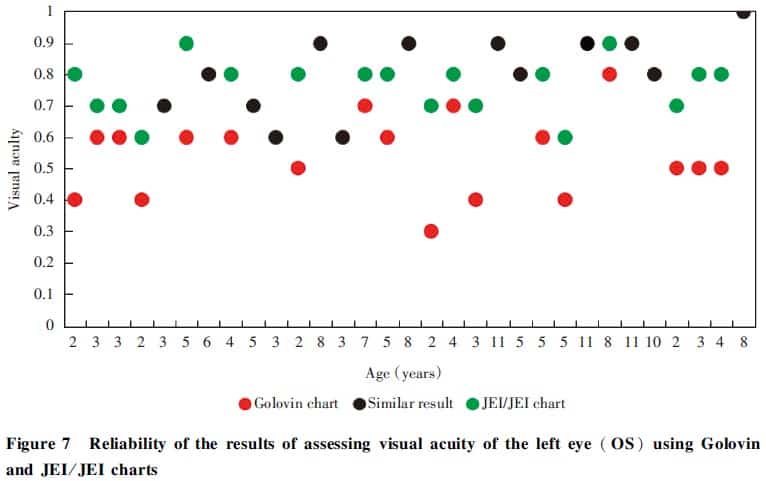
When the results of visometry coincided, which occurred in 16 (51.6%) and 13 (41.9%) cases, respectively, when determining the visual acuity of the right and left eyes, the effectiveness of both methods was evaluated as identical. In 15 cases (48.4%) when examining the right eye and 18 (58.1%) cases – the left, the visometry data differed with a homogeneous trend: the indicator obtained using the JEI/JEI charts exceeded the same indicator when using the Golovin charts in the range of 0.1 – 0.4, and in children aged 2-5 years – 0.2 – 0.4. In our opinion, the main reason for such differences, especially for children of the age category 2-5 years, was the difficulty of correctly assessing the orientation of the Landolt rings due to the insufficient development of left-right orientation [21-29]. The Russian manual notes the following, “Spatial orientation is carried out on the basis of direct perception of space and verbal designation of spatial categories (location, distance, spatial relationships between objects). The concept of spatial orientation includes an assessment of distances, sizes, shapes, the relative position of objects and their position relative to the body of the orientee” [21]. In addition, it is known that in the last months of the first year of life, a deaf child discovers differences from a hearing person due to lack of hearing [22]. They are expressed in the fact that the number of cognizable objects and their properties is less, observation develops more slowly, and the selection of visually perceived objects, not supported by hearing, is less active than in hearing children. In the second and partly in the third year of life, the child learns to use most of the surrounding household items. First, he/she uses the object strictly for its intended purpose, and then familiarity with the basic functions of objects allows the child to operate more freely with it. It can perform an action without an object or with another object, which gives it an unusual role. This separation of action from object characterizes the origin of the symbolic function of consciousness and determines the origin of the game [23]. In the second year of life, the child develops an active interest in surrounding objects, the desire for active manipulation of objects, both non-specific and specific. On the basis of imitating the actions of an adult with objects, a hearing-impaired child learns some of these skills, which contributes to the development of perception. Practical orientation to the properties of objects develops mainly in the third year of life: children begin to pay attention to the size, color, shape of objects, spatial relationships between them [24-25]. In practical activities with objects and toys, there is a development of correlative subject actions. Thus, a practical orientation on the qualities and properties of objects develops in most deaf children in the third year of life, while in normally hearing toddlers it is formed mainly in the second year of life. Despite the fact that in most cases, deaf and hard of hearing children have adequate actions with objects or toys, their uniqueness, unrevealed, incompleteness is noted (the child only brings a spoon to the doll’s mouth, acts with a comb through the hair without touching them). Imitating others, he/she transfers the actions of adults into his experience, however, he does not perceive them completely, fragmentally, insufficiently comprehending their direction and meaning. For most children, an independent analysis of the situation, the allocation of essential properties of objects for this activity is not yet available [26]. The later appearance of objective actions is associated with a misunderstanding of the adult’s speech and a slower formation of the “evaluation seeker” view, which helps to draw attention to the subject and to the adult’s actions with it. Thus, one of the main reasons for lagging in orientation in space is the absence or sharp underdevelopment of speech communication and means of non-verbal communication (gestures, facial expressions, etc.). The peculiarities in the development of perception in deaf children in comparison with hearing children become more pronounced in the second-third years, since hearing children master speech during this period, which significantly contributes to their sensory development. Its levels in deaf and hard-of-hearing children by the age of three are extremely heterogeneous, they depend on the state of speech, the participation of adults in the development of the baby, ways of communicating with him [27]. Taking into account the above, the principle of determining the direction of the rupture of the Landolt ring, which is the basis of well-known visometry techniques, can cause certain difficulties in children of the younger age group.
In addition, the time required to get an answer to the subjects when using the charts tested in the study for visometry was analyzed. In Figure 8, cases of coincidence of the study time using different charts are indicated by black dots. If the results differ, the green dots indicate the data obtained from the JEI/JEI charts, and the red dots indicate the Golovin charts.
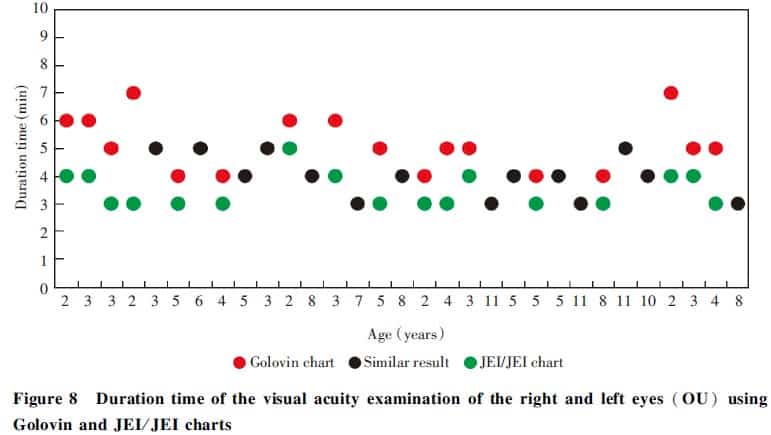
In 14 (45.1%) cases, the total visometry time of the right and left eyes according to the Golovin and JEI/JEI charts was identical, and in 17 (54.9%) which examined using the JEI/JEI charts, a reducing in the study time compared to the Golovin chart in the range of 1 – 4 minutes was noted.
The principle of constructing the JEI/JEI charts combined with the presence of cards duplicating optotypes significantly facilitates the process of visometry in deaf-mute children. In addition, the study is simplified by reducing the distance between the diagrams and the object to 2.5 meters, as well as by passing the visual inspection procedure, the quality of interactive games for children. Thus, the reduced distance improves the doctor’s contact with the patient, since there is an element of play in it. Showing one or another optotype from the JEI/JEI chart, the doctor jokingly asks the child to pick up a card with the corresponding image – in this process, it is very easy to interest children 2-5 years old and call for active contact.
3 Disscussion
The results obtained indicate the prospects of using the JEI/JEI chart in clinical practice for visometry in deaf-mute children aged 2-5 years. The developed technique, which includes cards duplicating optotypes, simplifies and increases the effectiveness of visometry in children due to the recognition of the presented objects and shortening the study time in each case.
The positive effect of using the proposed method:
– It is carried out for all children from 2 years old and preschool children and deaf-mutes: children who have applied for ophthalmological help. There are no contraindications.
– The accuracy of checking visual acuity by the claimed method, in 15 cases (48.4%) when examining the right eye and in 18 (58.1%) cases – the left, the visometry data differed in a homogeneous trend: the indicator obtained using the JEI/JEI charts exceeded the same indicator when using the Golovin Diagram in the range of 0.1 – 0.4, and in children aged 2-5 years – 0.2 – 0.4 (Figure 6, 7), than according to the prototype method according to the Golovin chart, this means that the proposed method for testing visual acuity in deaf-mute children is more accurate and reliable than the standard study according to the Golovin chart, and has a number of advantages.
-The developed method is a simpler, more accessible and faster indicative way to study visual acuity in deaf-mute children. In the study of the new method of visual acuity in children, the understanding of instructions, speed, accuracy of execution, adequacy of action, interest, the result of development, learning ability are recorded.
-It is possible to check visual acuity even for deaf-mute children.
-The presence of a language barrier (different languages) is also taken into account, the child cannot name the picture, a translator is required, who may not always be nearby. Cards with images from the JEI/JEI chart should be given into the hands of the child. When showing a sign, the child picks up a card with the image of the corresponding image.
-It is possible to conduct an examination outside the oculist’s office, at home, on a trip and when examining children in preschool institutions, the study on the JEI/JEI chart is carried out from a distance of 2.5 m from the chart, which consists of 2 A4 sheets, on which 10 rows of optotypes with decreasing (from 35 to 3.5 mm) are located the size and an indication of the corresponding visual acuity.
In our opinion, the proven principle of duplicating the presented optotypes with the help of additional cards, hereinafter Referred to as the Dr. Eldor technique for visometry in deaf-mute children aged 2-5 years, can be recommended for use in clinical practice for visometry in deaf-mute children aged 2-5 years with foreign colleagues when using the well-known charts as Lea, Orlova and others (Figure 9, 10).
Conflict of interest None declared
Acknowledgments The study was conducted under the guidance of Academician of the Russian Academy of Sciences, Doctor of Medical Sciences, Professor Avetisov Sergey Eduardovich. I would like to express my gratitude and thank my supervisor for his warmth, guidance, patience, support and everything he taught me throughout the study and the leadership of the Sechenov First Moscow State Medical University (Sechenov University) of the Ministry of Health of the Russian Federation for continuing this study, which allowed us to carry out this study and complete it.
Authors contributions Jonnazarov E.I. : Research concept and design, examination of patients, collection and processing of the material, text writing, preparation of illustrations, final editing; Avetisov S.E. : Research concept and design, final editing; Cervatiuc M.I. : Examination of patients, collection and processing of the material, text writing, preparation of illustrations
References
[1] World Health Organization. World Hearing Day 2019 in the Russian Federation – check your hearing[EB/OL]. (2019-03-14)[2022-05-10]. https://www.who.int/europe/news/item/14-03-2019-world-hearing-day-2019-in-the-russian-federation-check-your-hearing.
[2] Alexander JC. Ocular abnormalities among congenitally deaf children[J]. Can J Ophthalmol, 1973, 8(3):428-33.
[3] Bist J, Adhikari P, Sharma AK. Ocular morbidity in hearing impaired schoolchildren[J]. Child Care Health Dev, 2011, 37(3):394-397. DOI: 10.1111/j.1365-2214.2010.01137.x.
[4] Braly K. A study of defective vision among deaf children[J]. Am Ann Deaf, 1938 83:192.
[5] Guy R, Nicholson J, Pannu SS, et al. A clinical evaluation of ophthalmic assessment in children with sensori-neural deafness[J]. Child Care Health Dev, 2003, 29(5):377-384. DOI: 10.1046/j.1365-2214.2003.00355.x.
[6] Hanioğlu-Kargi S, Köksal M, Tomaç S, et al. Ophthalmologic abnormalities in children from a Turkish school for the deaf[J]. Turk J Pediatr, 2003, 45(1):39-42.
[7] Khandekar R, Al Fahdi M, Al Jabri B, et al. Visual function and ocular status of children with hearing impairment in Oman: a case series[J]. Indian J Ophthalmol, 2009, 57(3):228-229. DOI: 10.4103/0301-4738.49400.
[8] Mafong DD, Pletcher SD, Hoyt C, et al. Ocular findings in children with congenital sensorineural hearing loss[J]. Arch Otolaryngol Head Neck Surg, 2002, 128(11):1303-1306. DOI: 10.1001/archotol.128.11.1303.
[9] Saunders K. Testing visual acuity of young children: an evidence-based guide for optometrists[J]. Optom Pract, 2010, 11(4):161-168.
[10] Avetisov SE. Ophthalmology: a national guide[M]. Russia:GEOTAR-Media, 2008:944.
[11] Kopaeva VG. Eye diseases[M]. Russia:GEOTAR-Media, 2018:385.
[12] Kushel TG. Handbook of medical optics[M]. Russia:GEOTAR-Media, 2016:192.
[13] Rosenblum Yu Z. Optometry[M]. Russia:April, 2017:191.
[14] Sverdlik A Ya. Optometry for novice optometrists[M]. Russia:GEOTAR-Media, 2017:372.
[15] Sidorenko EI. Ophthalmology[M]. Russia:GEOTAR-Media, 2018:649.
[16] Somov EE. Clinical ophthalmology[M]. Russia:MEDpress-inform, 2017:416.
[17] Golovin SS, Sivtsev DA. Charts for the study of visual acuity[M]. Leningrad:State Publishing House, 1925:8.
[18] Sivtsev, Dmitry Alexandrovich. Fonts and charts for visual acuity research[M]. 12th ed. Leningrad:Medgiz, 1940:6.
[19] Jonnazarov EI, Dibirova SM, Ismoilov MI., et al. Method for assessing visual acuity in healthy preschool children and deaf-mute children:RU2703697C1[P]. 2019-10-21.
[20] Jonnazarov EI, Narbut MN, Ismailov MI, et al. Improving the methodology of visual acuity assessment in children aged 2 to 5 years[J]. The EYE GLAZ, 2022, 24(1):7-12. DOI: 10.33791/2222-4408-2022-1-7-12.
[21] Stolyar A, Berezina R, Mikhailova Z, et al. Formation of elementary mathematical concepts in preschoolers[M]. Russsia:GEOTAR-Media, 1988:304.
[22] Shifa Zh I, Solovyova IM. The development of cognitive activity of deaf-mute children[M]. Russsia:Uchpedgiz, 1957:84.
[23] Inshakova OB, Kolesnikova AM, Sekachev MV. Spatial-temporal representations: examination and formation in schoolchildren with expressive alalia[M]. Russia:Educational and methodical manual, 2006:80.
[24] Krushelnitskaya OI. Right – left, up – down: the development of spatial perception in children aged 6-8 years[M]. Russsia:Uchpedgiz, 2008:8.
[25] Pavlova TA. The development of spatial orientation in preschoolers and younger schoolchildren[M]. Russsia: State Publishing House, 2004:17.
[26] Semago NY, Semago MM. Research of the peculiarities of the development of the cognitive sphere of preschool and primary school age children. Diagnostic Kit[M]. Russsia:ARKTI, 1999:23-31.
[27] Isenina EI. To parents about the mental development and behavior of deaf children of the first years of life[M]. Russia:JSC IG “Progress”, 1999:80.
[28] Mikhailova ZA, Nepomnyashchaya RL, Polyakova MN. The development of spatial representations in preschool age. Theories and technologies of mathematical development of preschool children. Anthology[M]. Russia:Center for Pedagogical Education, 2008:91.
[29] Semago N Ya, Semago MM. Methods of formation of spatial representations in preschool and primary school age children[M]. Russia:Iris-press, 2007:129.