Abstract [View PDF] [Read Full Text]
Objective
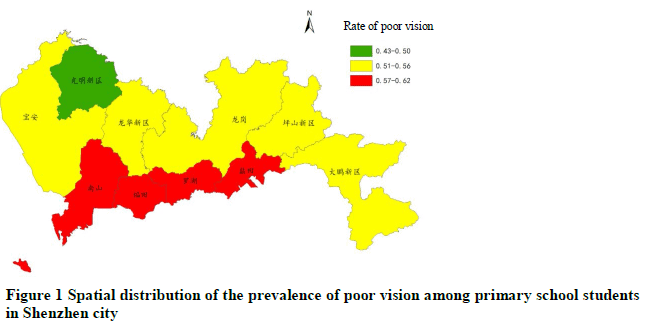
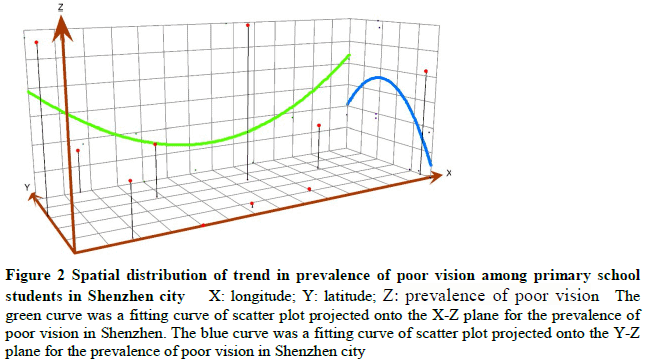
To analyze the prevalence of poor vision and spatial distribution characteristics among primary school students in Shenzhen.
Methods
A cross-sectional study was conducted.Vision screening among primary school students in Shenzhen was carried out by myopia screening hospitals organized by Shenzhen Myopia Prevention and Control Center for Children and Adolescents using the logarithmic visual acuity chart in 2019.The prevalence of poor vision in different districts, different genders and different grades was calculated.Spatial distribution of the prevalence of poor vision was analyzed with Arcgis 10.2 software.This study adhered to the Declaration of Helsinki.Written informed consent was obtained from guardian of each subject.The study protocol was approved by an Ethics Committee of Shenzhen Eye Hospital (No.20201230-06).
Results
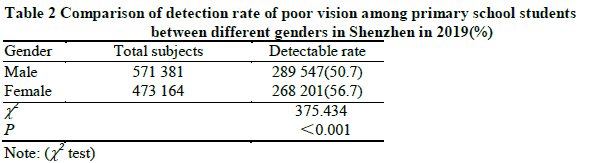
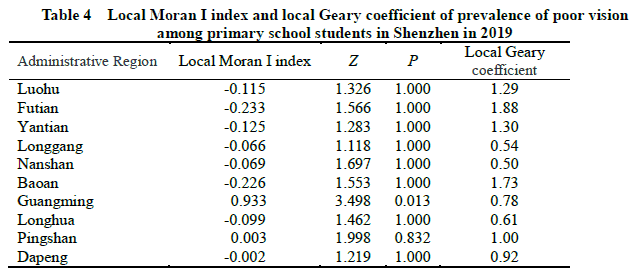
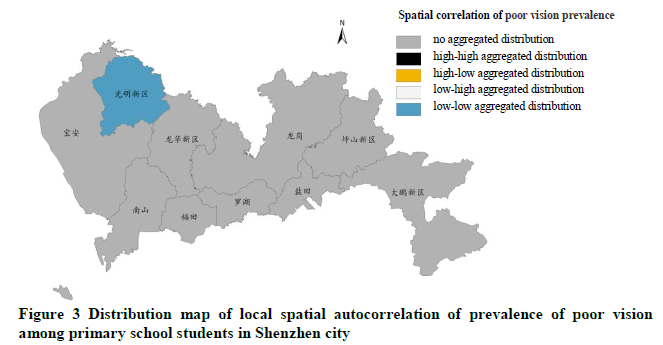
A total of 1 044 545 students received the visual acuity examination.The prevalence of poor vision among primary school students in Shenzhen in 2019 was 53.4%(557 748/1 044 545). The prevalence of poor vision among primary school students in the former Shenzhen Special Economic Zone was 56.7%(172 771/304 532), which was higher than 52.0%(384 977/740 013) in areas outside the former Shenzhen Special Economic Zone, and the prevalence of poor vision among girls was 56.7%(268 201/473 164), which was higher than 50.7%(289 547/571 381) among boys, and the differences were statistically significant (χ2=192.412, 375.434; both at P<0.001). As the grade increased, the prevalence of poor vision firstly decreased and then increased, showing an increasing tendency in general.The prevalence rate of poor vision among primary school students among grade 1 to 6 was 49.8%(99 615/200 203), 44.0%(86 521/196 800), 47.2%(82 848/175 331), 54.5%(89 737/164 731), 60.8%(96 271/158 298), and 68.9%(102 756/149 182), respectively, and a significant difference was found (χ2=2 871.017, P<0.001). The global Moran I index in Shenzhen was 0.278.The local Moran I index and Geary coefficient in Guangming District were 0.933 and 0.78, respectively.The prevalence of poor vision in Guangming District and its surrounding areas was a low-low cluster.
Conclusions
The prevalence of poor vision among primary school students in Shenzhen is spatially aggregated.
Key words:
Figures and tables


Contributor Information
Shenzhen Eye Hospital, Shenzhen Eye Hospital Affiliated to Jinan University, Shenzhen Eye Institute, Shenzhen 518040, China
Shenzhen Eye Hospital, Shenzhen Eye Hospital Affiliated to Jinan University, Shenzhen Eye Institute, Shenzhen 518040, China
Shenzhen Eye Hospital, Shenzhen Eye Hospital Affiliated to Jinan University, Shenzhen Eye Institute, Shenzhen 518040, China
Shenzhen Eye Hospital, Shenzhen Eye Hospital Affiliated to Jinan University, Shenzhen Eye Institute, Shenzhen 518040, China
Shenzhen Eye Hospital, Shenzhen Eye Hospital Affiliated to Jinan University, Shenzhen Eye Institute, Shenzhen 518040, China
Shenzhen Eye Hospital, Shenzhen Eye Hospital Affiliated to Jinan University, Shenzhen Eye Institute, Shenzhen 518040, China
Shenzhen Eye Hospital, Shenzhen Eye Hospital Affiliated to Jinan University, Shenzhen Eye Institute, Shenzhen 518040, China