Abstract [View PDF] [Read Full Text]
Objective
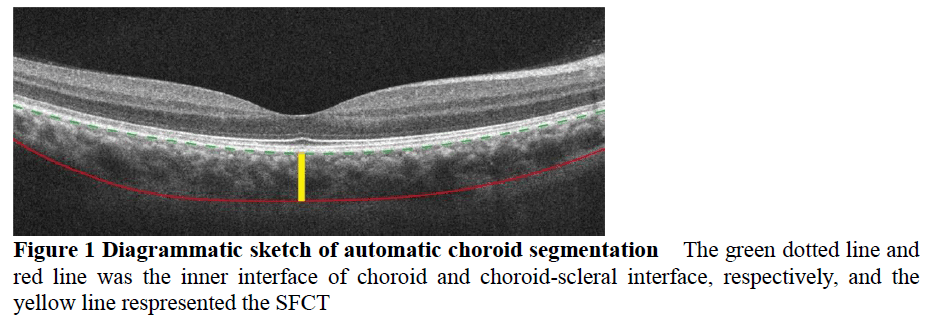
To analyze the changes of subfoveal choroidal thickness (SFCT) and choroidal volume in type 2 diabetes patients with diabetic retinopathy (DR) through automated choroid segmentation.
Methods
A cross-sectional study was conducted.Sixty-four patients (88 eyes) with type 2 diabetes diagnosed in The First Affiliated Hospital with Nanjing Medical University from May 2016 to May 2017 were enrolled, including 27 males (32 eyes) and 37 females (56 eyes), with an average age of (62.7±7.4) years and an average diabetes duration of (13.7±7.2) years.Best corrected visual acuity, slit lamp ophthalmoscopy, indirect ophthalmoscopy and spectral domain optical coherence tomography (SD-OCT) examination were carried out among all the patients.The patients were divided into non-DR (NDR) group (28 eyes), nonproliferative DR (NPDR) group (36 eyes) and proliferative DR (PDR) group (24 eyes) according to the Early Treatment Diabetic Retinopathy Study.Nineteen age-matched normal subjects (32 eyes) were enrolled as normal control group.SFCT and choroidal volume were measured through automated choroid segmentation based on SD-OCT with enhanced depth imaging.This study adhered to the Declaration of Helsinki.The study protocol was approved by the Ethics Committee of The First Affiliated Hospital with Nanjing Medical University (No.2017-SR-176).
Results
Mean SFCT and choroidal volume of normal control group, NDR group, NPDR group and PDR group were (277.8±45.3)μm and (8.8±1.0)mm3, (220.9±38.7)μm and (7.6±1.3)mm3, (231.8±26.7)μm and (8.2±0.9)mm3, (252.0±42.2)μm and (8.7±1.0)mm3, respectively, with significant overall differences among the groups (F=14.615, P<0.001; F=7.711, P<0.001). Mean SFCT and choroidal volume were significantly smaller in NDR and NPDR group than those in normal control group (both at P<0.05). Mean SFCT and choroidal volume of PDR group was greater than those of NDR group (both at P<0.05).
Conclusions
SFCT and choroidal volume decrease during the early course of diabetes and increase significantly as DR worsens from NDR to PDR.
Key words:
Figures and tables


Contributor Information
Department of Ophthalmology, The First Affiliated Hospital with Nanjing Medical University (Jiangsu Province Hospital), Nanjing 210029, China
School of Computer Science and Engineering, Nanjing University of Science and Technology, Nanjing 210094, China
Department of Ophthalmology, Yixing People’s Hospital, Yixing 214200, China
Department of Ophthalmology, The First Affiliated Hospital with Nanjing Medical University (Jiangsu Province Hospital), Nanjing 210029, China
Department of Ophthalmology, The First Affiliated Hospital with Nanjing Medical University (Jiangsu Province Hospital), Nanjing 210029, China