·Experimental research·
Meibomian gland dysfunction and expressions of inflammatory factors and lipid metabolic factors in diabetic mice
Zou Yuanyuan, Liu Xuemei, Qi Yuanyuan, Zhao Shaozhen
Tianjin Key Laboratory of Retinal Functions and Diseases, Tianjin Branch of National Clinical Research Center for Ocular Disease, Eye Institute and School of Optometry, Tianjin Medical University Eye Hospital, Tianjin 300384, China
Zou Yuanyuan is now working in the Department of Ophthalmology, Cangzhou Central Hospital, Cangzhou 061000, China
Corresponding author: Zhao Shaozhen, Email: zhaosz1997@sina.com
[Abstract] [View PDF in English] [View PDF in Chinese] [Read Full Text]
Objective To identify meibomian gland function and morphological changes, as well as expressions of inflammatory factors and lipid metabolic factors, in meibomian glands of diabetic mice.
Methods Fifty 8-week-old male C57BL/6 mice were divided into a normal control group (n=20) and diabetes model group (n=30) according to a random table method. The diabetes model was established by intraperitoneal injection of 10 mg/mL streptozotocin. Mouse tail-vein blood glucose levels ≥ 16.7 mmol/L were considered diabetic. Blood glucose was measured weekly, and body weight was compared between the two groups. Ten mice were randomly selected from both groups at an interval of 4 weeks for corneal sodium fluorescein staining, to evaluate the integrity of the corneal epithelium. Five mice were randomly selected from the two groups and were sacrificed via anesthesia to collect meibomian gland tissues for hematoxylin and eosin staining, and to observe morphological changes at 8 and 16 weeks after diabetes onset, respectively. At 16 weeks, the meibomian glands of five mice randomly selected from both groups were stained with Oil Red O to observe the distribution of lipids. Real-time fluorescence quantitative-PCR was performed to detect the relative expressions of tumor necrosis factor (TNF)-α, pigment epithelium derived factor (PEDF), peroxisome proliferators-activated receptor γ (PPARγ), and adipose differentiation-related protein (ADFP) mRNA in meibomian glands. The use and care of animals complied with the ARVO Statement for the Use of Animals in Ophthalmic and Vision Research. The study protocol was approved by the Institutional Animal Care and Use Committee of Tianjin Medical University Eye Hospital (No. TJYY20190630009).
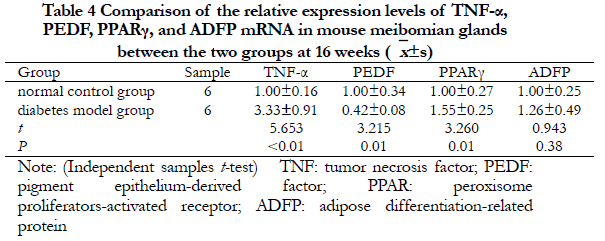
Results The successful percentage of diabetes in streptozotocin-treated mice was 100%, and the survival percentage was 83.3% (25/30). The weight was significantly lower and the blood glucose was significantly higher in the diabetes group at 8 and 16 weeks, when compared with the normal control group (all, P<0.05). There were significant differences in corneal fluorescein staining scores at different time points in the diabetes group (F=27.155, P<0.05). In the diabetes group, thinner walls of meibomian gland ducts, enlarged lumens of the ducts, and dilated acini and Oil Red O-stained lipid depositions in most acini were observed. At 16 weeks, the relative expressions of TNF-α and PPARγ mRNA in meibomian glands of the diabetes group were 3.33±0.91 and 1.55±0.25, respectively, which were significantly higher than 1.00±0.16 and 1.00±0.27, respectively, of the normal control group (both, P<0.05). The expression of PEDF mRNA in the diabetes group was 0.42 ± 0.08, which was significantly lower than 1.00 ± 0.34 in the normal control group (P<0.05). There was no significant difference in adipose ADFP mRNA expressions between the two groups (t=0.943, P=0.38).
Conclusions Inflammatory factors and lipid metabolic factors such as TNF-α, PEDF, and PPARγ may be involved in the pathogenesis of meibomian gland dysfunction induced by diabetes.
[Key words] Meibomian gland dysfunction; Diabetes complications; Tumor necrosis factor-α; Pigment epithelium-derived factor; Peroxisome proliferators-activated receptor γ; Adipose differentiation-related protein
Fund program: National Natural Science Foundation of China (81970769)
DOI: 10.3760/cma.j.cn115989-20210207-00098
Because the prevalence of diabetes has recently increased, diabetes-related eye complications have attracted increasing attention from ophthalmologists1. De Freitas et al.2 reported that 120 patients with type 2 diabetes were more prone to dry eye, with a prevalence of 38.3%. Dry eye consensus by the Asian Dry Eye Society proposed that dry eye is a multifactorial chronic disease, and long-term use of electronic devices and meibomian gland dysfunction (MGD) are considered risk factors for dry eye. Rupture time shortening of the lacrimal membrane and instability of the lacrimal membrane are necessary conditions for the diagnosis of dry eye3. A large epidemiological study in Spain examined 937 patients, and reported that most diabetics were characterized by MGD signs but no dry eye complaints4. Liu and co-workers proposed that asymptomatic MGD may be an early sign of dry eye and discomfort in patients with type 2 diabetes5. MGD parameters are related to glycated hemoglobin levels and the course of diabetes. MGD is a chronic and diffuse facial plate gland lesion characterized by terminal catheter obstruction of the facial gland and/or abnormal quality or quantity secretion of eyelid esters. It can cause abnormal tear film stability and ocular surface inflammation. Tumor necrosis factor-α (TNF-α) is an early and important inflammatory mediator in the inflammatory response. Fat cells can secrete TNF-α, and the levels of TNF-α in conjunctiva and tears in diabetic patients are significantly increased6-7. We therefore speculated that TNF-α and esters in meibomian glands were related to diabetes-induced MGD. Pigment epithelium derived factor (PEDF) has an anti-inflammatory function8. Peroxisome proliferators-activated receptor-γ (PPAR-γ) regulates lipid metabolism9. Adipose differentiation-related protein (ADFP) is expressed in almost all types of cultured mammal cells. ADFP can be used as an indicator of lipid accumulation in cells10. This study therefore aimed to characterize the pathogenesis of diabetes-induced MGD by determining the expressions of inflammatory factors and lipid metabolism factors in meibomian gland tissues of diabetic mice, to provide a reference for the prevention, diagnosis, and treatment of diabetic-related ocular diseases.
1 Materials and methods
1.1 Materials
1.11 Experimental animals
Fifty 8-week-old male C57BL/6 mice were purchased from Beijing Weitong Lihua Experimental Animal Technology [Beijing, China; license no. SCXK (Beijing) 2016-0006], with body weights of 18−20 g. The animals had no eye disease. They were divided into 20 normal control mice and 30 diabetes model mice using a random number table, and raised in the Animal Experiment Center of the Institute of Ophthalmology of Tianjin Medical University. The feeding environment met the requirements of the animal environmental facilities of medical experiments, and the research plan was approved by the Laboratory Animal Management and Use Committee of Tianjin Medical University Eye Hospital (Approval no: TJYY20190630009).
1.1.2 Main reagents and instruments
Streptozotocin (STZ) and Oil Red O were from Sigma-Aldrich (St. Louis, MO, USA); the reverse transcription kit was from Thermo Fisher Scientifc (Waltham, MA, USA). The KZ II high-speed tissue grinder was from Wuhan Saiwei Biotechnology (Wuhan, China). The ABI7900 real-time fluorescence quantitative PCR instrument was from Applied Biosystems (South San Francisco, CA, USA). The inverted fluorescence microscope was from Nikon (Tokyo, Japan).
1.2 Methods
1.2.1 Establishment of a diabetes model
One week after adaptive breeding, the diabetic group was intraperitoneally injected with 60 mg/kg of 10 mg/mL STZ buffer solution for 5 d, and the normal control group was intraperitoneally injected with the same amount of 0.1 mol/L pH 4.0 sodium citrate buffer solution. The mice had free access to feed and water for 72 h. The diabetes group was considered successful if blood glucose from the tail vein was ≥ 16.7 mmol/L glucose. The mice in each group were fed with a standard diet, and the blood glucose and body mass of 20 mice in each group were regularly checked, and the condition of the preoptic nodes was regularly observed.
1.2.2 Assessment of corneal epithelial integrity in mice using corneal sodium fluorescein staining
At weeks 4, 8, 12, and 16 after modeling, 10 mice in the diabetes mellitus group and 10 mice in the normal control group were randomly selected. The corneal surface of the right eye was observed and scored with a cobalt blue filter using a slit lamp microscope, 30 s after application of 5 µL of a 10 g/L sodium fluorescein solution. Sodium fluorescein staining scores used a 12-point method; the cornea was divided into four quadrants, each of which was 0~3 points, the non-stained sections were 0 points, 1~30 dot color was 1 point, > 30 dot coloring, but the dye was not fused was 2 points, and corneal dot coloring fusion, filaments, and ulcers was 3 points11.
Ten mice in the diabetic group and 10 mice in the normal control group were randomly selected 4, 8, 12, and 16 weeks after modeling, and the corneal surface of the right eye was stained with 5 µL of 10 g/L sodium fluorescein; after 30 s, it was observed and scored using a slit-lamp microscope with a cobalt blue filter. Sodium fluorescein staining was scored using a 12-point method; the cornea was divided into four quadrants, and each quadrant was scored from 0~3. No staining was scored as 0, 1~30 punctate staining was scored as 1, > 30 punctate staining but the staining was not fused was scored as 2, and the appearance of corneal punctate staining fusion, filaments, and ulcers was scored as 3.
1.2.3 Hematoxylin-eosin staining of meibomian glands in mice
Five mice in the diabetic model group and five mice in the normal control group were arbitrarily selected at 8 and 16 weeks after modeling, and were euthanized by anesthesia. The upper and lower eyelids of both eyes were sutured together and quickly removed together with the eyeballs, then fixed in 4% (by volume) acidic formaldehyde solution for 72 h. After rinsing in balanced salt solution, gradient ethanol dehydration was conducted, xylene was used to induce transparency, and paraffin was used for embedding. Whole sections of the eye face were then cut in the sagittal direction with a thickness of 4 µm, and paraffin sections were dewaxed in xylene, placed in gradients of ethanol, and stained with hematoxylin for 2 min. Then, 1% (v/v) hydrochloric acid in ethanol was used for 20 s, 1% hydrochloric acid (v/v) ethanol was used for 20 s, and the sample was incubated in 1% ammonia for 20 s, stained with eosin for 2 min, incubated in gradients of ethanol, dewaxed with xylene, sealed with neutral resin, and observed using a light microscope.
1.2.4 Observation of the lipid ester distribution in mouse meibomian glands using Red Oil O staining
Five mice in the diabetic group and five mice in the normal control group were randomly selected at 16 weeks after modeling, and after euthanizing with anesthesia, the upper and lower eyelids of both eyes were sutured together, and the eyeballs were quickly removed and incubated with OCT embedding solution, snap-frozen in liquid nitrogen, cut in the sagittal direction, and rewarmed at room temperature for 20−30 min. The samples were then fixed with 4% paraformaldehyde for 10 min; stained with Red Oil O working solution, and incubated at room temperature for 3 min. The sections were incubated at 37°C for 1 h; washed with phosphate-buffered saline (PBS) to remove the excess dye, stained with hematoxylin for 5 min, rinsed with PBS, sealed with Vector H-1000 sealer, vacuum pumped to remove the excess liquid under and around the coverslip and to exclude the air bubbles, and observed using a light microscope. Esters were stained orange-red using Red Oil O dye.
1.2.5 Real-time fluorescence quantitative PCR detection of the relative expressions of TNF-α, PEDF, PPAR-γ, and ADFP mRNA in mouse eyelid gland tissues
Six mice in the diabetes group and the six mice in the normal control group were arbitrarily selected 16 weeks after modeling, then euthanized using anesthesia. After removing the eyelid skin, the upper and lower eyelid plate gland tissues were removed, then quickly frozen in liquid nitrogen and stored at -80°C. Eyelid glandular tissues were incubated with 1 mL TRIzol (Invitrogen, Carlsbad, CA, USA) to extract total tissue RNA. A Nanodrop spectrophotometer (Thermo Fisher Scientific) was used to determine total RNA purity and content, and reverse transcription was used to synthesize cDNA. The primers (Table 1) were designed using the online PubMed NCBI gene bank, and online Primer Blast was used to check the specificity of the corresponding species, which was synthesized by Suzhou Jinweizhi Biotechnology (Suzhou, China). The cDNA was used as a template for gene primers, and fluorescence quantified PCR amplified the genes for each purpose (reaction system: 25 µL) using the following conditions: 95°C pre-denaturation for 10 min; 95°C denaturation for 10 s, 60°C annealing and extension for 1 min, with a total of 40 cycles. The melting curve was analyzed after amplification. The relative expression of each target gene was calculated using two methods with β-actin as an internal reference.

1.3 Statistical methods
SPSS 20.0 statistical software for Windows (SPSS, Chicago, IL, USA) was used for statistical analysis. Data on measures were confirmed to be normally distributed using the Shapiro-Wilk test and expressed as ±s. Data between groups were tested for chi-square using Levene’s test. The overall comparison of body mass and blood glucose between the diabetic model group and the normal control group at different times were performed by two-way repeated measures analysis of variance (ANOVA). Comparison of corneal sodium fluorescein staining scores at each time point in the diabetic model group was performed by repeated-measures one-way ANOVA, and the comparison between groups was performed using Tukey’s test. The t-test for independent samples was used to compare differences in the relative expressions of each target gene between the two groups. A value of P < 0.05 was considered statistically significant.
2 Results
2.1 Comparison of the general condition of the two groups of mice
All mice in the diabetes group met the diagnostic criteria of a diabetes model. During the experiment, there was no death in the normal control group, and a total of five mice in the diabetes group died during the feeding process, accounting for 83.3% survival. The physical mass of the mice in the normal control group increased with time, the blood glucose remained at normal levels, the hair color was brown, black, smooth, and shiny, and consumption of the daily diet and drinking water was normal. In contrast, the body mass of mice in the diabetes model group decreased with observation times. The hair color was dull and shiny, and the daily dietary intake, drinking water, and urine volumes significantly increased, when compared with the normal control group, which was consistent with the clinical symptoms of increased drinking, increased eating, increased urination, and weight loss. In addition, the blood glucose was > 16.7 mmol/L (Table 2).

2.2 Comparison of sodium fluorescein staining in the corneas of the two groups of mice
The corneas of mice were transparent at 4 weeks in the diabetes model, but sodium fluorescein staining of corneal epithelium was not observed. In the diabetes model animals at 8 weeks, the epithelium around the cornea was rough and stained with sodium fluorescein. At 12 weeks, the rough range of corneal epithelia in mice increased, with significantly increased sodium fluorescein staining. At 16 weeks, most of the corneal epithelia was rough, with sodium fluorescein staining. In contrast, corneal epithelia of the normal control group was intact with no sodium fluorescein staining (Figure 1).
 According to corneal sodium fluorescein staining criteria, the corneal sodium fluorescein staining scores of mice in the diabetic model group increased as the duration of diabetes increased, with statistically significant differences in overall comparisons between different time points (F=27.155, P<0.05) (Table 3).

2.3 Comparison of eyelid gland tissue morphologies in the two groups of mice
At 8 weeks after modeling, the ducts of meibomian glands in normal control and diabetic mice were structurally normal, and the cells were mostly basal cells. At 16 weeks, the secretory glandular vesicles were transitional in mature cells in the normal control and diabetic groups, with the glandular vesicles in the diabetic model group larger in size, with some cells having larger nuclei and lighter color than the normal control group. The structure of the squamous epithelial cells in the excretion catheter was disordered, the wall of the catheter became thinner, the connective fibrous tissues around the catheter increased, and the connective fibrous tissues around the catheter increased (Figure 2).

2.4 Comparison of lipid distributions of mouse meibomian gland tissues between the two groups of mice
At 16 weeks, most of the acinus in the eyelid gland tissue of mice in the diabetes model group showed orange-red positive staining, but only a small amount of acinus tissues were stained orange-red in the normal control group (Figure 3).

2.5 Comparison of TNF-α, PEDF, PPARγ, and ADFP mRNA expression levels in meibomian gland tissues in the two groups of mice
At 16 weeks, the relative expressions of TNF-α and PPARγ mRNA in the meibomian gland tissues of mice in the diabetes group were significantly higher than that of the normal control group, and the relative expression of PEDF mRNA was significantly lower than that of the normal control group. The differences were statistically significant (all, P<0.05). The relative expressions of ADFP mRNA between the two groups were not significantly different (t=0.943, P=0.38) (Table 4).
3 Discussion
The meibomian gland is mainly composed of acini and excretory ducts, and each meibomian gland can independently secrete and excrete esters. Melibine is an important component of the lipid layer of the tear film and plays a role in maintaining the stability12. Abnormal morphology and function of the meibomian gland can affect the excretion of esters, destroy the stability of the tear film, and lead to dry eye13. The meibomian gland is affected by nerve dysregulation, peripheral vascular changes, hormones, and other factors14-17. Because diabetes can damage peripheral blood vessels and cause neuropathy, patients with long-term hyperglycemia may experience decreased corneal nerve sensitivity, decreased corneal function, reduced vision, and greater susceptibility to dry eye symptoms18. Therefore, diabetes is closely related to MGD.
Ding et al.19 stimulated human meibomian glandular epithelial cells cultured in vitro with insulin, and found that their growth was dose-dependent on insulin, and excessive glucose induced apoptosis of meibomian gland epithelial cells in culture, indicating that insulin deficiency and/or hyperglycemia may increase the risk of abnormal function of facial plate glandular tissues. Yu et al.20 observed the morphology, structure, and function of meibomian glands in patients with type 2 diabetes mellitus, and found that with the prolongation of diabetes and the aggravation of diabetic retinopathy, abnormal meibomian gland structure became more obvious.
Based on the results of laser scanning confocal microscopy, the acini of meibomian glands in diabetic patients were seen to be dilated, irregular in shape, decreased in acini density, and a few acini showed atrophy and fibrosis. Baudouin et al.21 suggested that MGD was due to ester siltation in meibomian gland tissues, which in turn promoted bacterial growth and increased lipase release, leading to inflammatory reactions. Sullivan et al.22 observed meibomian gland epithelial cells cultured in high glucose, and found that hyperglycemia may lead to changes in the morphology of meibomian gland epithelial cells and the consumption of acini of meibomian gland progenitor cells. Free fatty acids in meibomian gland epithelial cells may lead to aggravation of an inflammatory reaction. In the present study, corneal sodium fluorescein staining was positive in the diabetes group, the acinus in meibomian gland tissues was expanded, and the ester was stasis.
There have been few studies on the relationships between diabetes mellitus and inflammatory factors in meibomian gland tissues. By analyzing the gene expression profiles of meibomian glands from leptin-deficient spontaneously diabetic mice, Yidz et al.22 found that apoptosis and inflammation-related genes were upregulated in type 2 diabetic meibomian glands. The results of the present study also showed that the relative expression of TNF-α mRNA was significantly increased in meibomian glands of diabetic mice, which may have been due to hyperglycemia affecting the aldose reduction pathway, advanced glycation end products (AGEs), and protein kinase C (PKC) pathway, leading to activation of inflammatory mediators, induction of oxidative stress, and increased secretion of inflammatory cytokines23-24. Thus, in hyperglycemia-stimulated meibomian glands, immune cells are activated, inflammatory responses are exacerbated, and TNF-α expression is significantly elevated.
By studying AGEs-exposed Hep3B cells, Yoshida et al.25 found that PEDF ameliorated the insulin resistance, which suggested that PEDF was correlated with AGEs, and was able to block JNK and IkB kinase-dependent IRS-1 serine phosphorylation, thereby inhibiting reactive oxygen species and C-reactive protein production, inflammation, and anti-oxidative stress effects. In the present study, PEDF expression was significantly reduced in facial gland tissues of diabetic mice, which may have been due to the inflammatory response in meibomian glands after stimulation by hyperglycemia and depletion of PEDF in tissues by paracrine and autocrine anti-inflammatory and antioxidant apoptotic effects, resulting in a reduction of PEDF. Therefore, for patients with diabetes-related MGD, anti-inflammatory therapy or PEDF supplementation may provide an effective therapy.
PPARy has been shown to be a marker of meibomian gland differentiation in mice, and is involved in the development of meibomian glands. Age-related MGD may involve changes in PPARy signaling and/or loss of stem cell renewal, leading to acinus atrophy and progression27. In aqueous-deficient dry eyes, the PPAR agonist, pyleglegridone, can maintain the normal secretion function and lacrimal membrane stability of the lacrimal gland by decreasing levels of nitric oxide induced by IL-1β in lacrimal glands. It has been speculated that PPARγ agonists could play an interventional therapeutic effect on lacrimal deficiency of dry eyes28. After gavage intervention with pioglitazone hydrochloride in the MRL lpr dry eye model mice, Liu et al.29 found that PPARγexpression was upregulated and inflammatory factor expression was downregulated in lacrimal gland tissues, while reduced damage to the lacrimal vesicles and ducts was observed, and symptoms and lacrimal gland damage in the dry eye animal model were improved. These results suggest that PPARγ agonists play a role in maintaining the stability of the aqueous layer of the tear film. The results of the present study also showed that PPARγ mRNA expression was significantly upregulated in the meibomian gland tissues of mice with diabetes, while an upward trend of ADFP mRNA expression was observed. Kim et al.30 showed that the PPARγ agonist, rosiglitazone, upregulated lipogenic gene expression, leading to lipid accumulation in human meibomian gland epithelial cells.
In conclusion, the expressions of inflammatory factors, TNF-α and PPARγ, were significantly increased, the expression of PEDF was decreased, and the volume of vesicles in the meibomian glands of mice stimulated by hyperglycemia was large. The structure of the ducts of the excretory part of the squamous epithelium was disorganized, the walls of the ducts were thinner, the lumen was enlarged, and the connective fibrous tissue around the ducts was increased, resulting in the induction of esters that could not be properly drained and suggesting that TNF-α, PEDF, and PPARγ may be involved in the development of diabetes-induced MGD.
Conflicts of interest None declared
Author contributions Zou YY: Study design, study implementation, data collection, manuscript writing; Liu XM, Qi YY: Study implementation, data collection; Zhao SZ: Study design, manuscript reviewing
References
[1]Negi A, Vernon SA. An overview of the eye in diabetes[J]. J R Soc Med, 2003, 96(6):266-272. DOI: 10.1258/jrsm.96.6.266.
[2]De Freitas GR, Ferraz G, Gehlen M, et al. Dry eyes in patients with diabetes mellitus[J]. Prim Care Diabetes, 2021, 15(1):184-186. DOI: 10.1016/j.pcd.2020.01.011.
[3]Wang H, Liu ZG. Dry eye consensus by Asian Dry Eye Society: interpretation[J]. Chin J Exp Ophthalmol, 2020, 38(10):871-876. DOI: 10.3760/cma.j.cn115989-20200828-00614.
[4]Viso E, Rodríguez-Ares MT, Abelenda D, et al. Prevalence of asymptomatic and symptomatic meibomian gland dysfunction in the general population of Spain[J]. Invest Ophthalmol Vis Sci, 2012, 53(6):2601-2606. DOI: 10.1167/iovs.11-9228.
[5]Wu H, Fang X, Luo S, et al. Meibomian glands and tear film findings in type 2 diabetic patients: a cross-sectional study[J/OL]. Front Med (Lausanne), 2022, 9:762493[2021-08-16]. https://pubmed.ncbi.nlm.nih.gov/35479935/. DOI: 10.3389/fmed.2022.762493.
[6] Liu R, Ma B, Gao Y, et al. Tear inflammatory cytokines analysis and clinical correlations in diabetes and nondiabetes with dry eye[J]. Am J Ophthalmol, 2019, 200:10-15. DOI: 10.1016/j.ajo.2018.12.001.
[7] Zhang C, Xi L, Zhao S, et al. Interleukin-1β and tumour necrosis factor-α levels in conjunctiva of diabetic patients with symptomatic moderate dry eye: case-control study[J/OL]. BMJ Open, 2016, 6(8):e010979[2021-08-18]. http://www.ncbi.nlm.nih.gov/pubmed/27489152. DOI: 10.1136/bmjopen-2015-010979.
[8] Sagheer U, Gong J, Chung C. Pigment epithelium-derived factor (PEDF) is a determinant of stem cell fate: lessons from an ultra-rare disease[J]. J Dev Biol, 2015, 3(4):112-128. DOI: 10.3390/jdb3040112.
[9] Corrales P, Izquierdo-Lahuerta A, Medina-Gómez G. Maintenance of kidney metabolic homeostasis by PPAR gamma[J/OL]. Int J Mol Sci, 2018, 19(7):2063[2021-08-18]. http://www.ncbi.nlm.nih.gov/pubmed/30012954. DOI: 10.3390/ijms19072063.
[10] Jester JV, Potma E, Brown DJ. PPARγ regulates mouse meibocyte differentiation and lipid synthesis[J]. Ocul Surf, 2016, 14(4):484-494. DOI: 10.1016/j.jtos.2016.08.001.
[11] Pauly A, Brignole-Baudouin F, Labbé A, et al. New tools for the evaluation of toxic ocular surface changes in the rat[J]. Invest Ophthalmol Vis Sci, 2007, 48(12):5473-5483. DOI: 10.1167/iovs.06-0728.
[12] Dursch TJ, Li W, Taraz B, et al. Tear-film evaporation rate from simultaneous ocular-surface temperature and tear-breakup area[J]. Optom Vis Sci, 2018, 95(1):5-12. DOI: 10.1097/OPX.0000000000001156.
[13] Bai Y, Ngo W, Khanal S, et al. Human precorneal tear film and lipid layer dynamics in meibomian gland dysfunction[J]. Ocul Surf, 2021, 21:250-256. DOI: 10.1016/j.jtos.2021.03.006.
[14] Bründl M, Garreis F, Schicht M, et al. Characterization of the innervation of the meibomian glands in humans, rats and mice[J/OL]. Ann Anat, 2021, 233:151609[2021-09-01]. https://pubmed.ncbi.nlm.nih.gov/33027687/ DOI: 10.1016/j.aanat.2020.151609.
[15] Arita R, Fukuoka S, Morishige N. New insights into the lipid layer of the tear film and meibomian glands[J]. Eye Contact Lens, 2017, 43(6):335-339. DOI: 10.1097/ICL.0000000000000369.
[16] Sullivan DA, Sullivan BD, Ullman MD, et al. Androgen influence on the meibomian gland[J]. Invest Ophthalmol Vis Sci, 2000, 41(12):3732-3742.
[17] Sullivan BD, Evans JE, Dana MR, et al. Impact of androgen deficiency on the lipid profiles in human meibomian gland secretions[J]. Adv Exp Med Biol, 2002, 506(Pt A):449-458. DOI: 10.1007/978-1-4615-0717-8_63.
[18] Derakhshan A, Abrishami M, Khajedaluee M, et al. Comparison between tear film osmolar concentration and other tear film function parameters in patients with diabetes mellitus[J]. Korean J Ophthalmol, 2019, 33(4):326-332. DOI: 10.3341/kjo.2013.0146.
[19] Ding J, Liu Y, Sullivan DA. Effects of insulin and high glucose on human meibomian gland epithelial cells[J]. Invest Ophthalmol Vis Sci, 2015, 56(13):7814-7820. DOI: 10.1167/iovs.15-18049.
[20] Yu T, Shi WY, Song AP, et al. Changes of meibomian glands in patients with type 2 diabetes mellitus[J]. Int J Ophthalmol, 2016, 9(12):1740-1744. DOI: 10.18240/ijo.2016.12.06.
[21] Baudouin C, Messmer EM, Aragona P, et al. Revisiting the vicious circle of dry eye disease: a focus on the pathophysiology of meibomian gland dysfunction[J]. Br J Ophthalmol, 2016, 100(3):300-306. DOI: 10.1136/bjophthalmol-2015-307415.
[22] Yıldız E, Zibandeh N, Özer B, et al. Effects of type 2 diabetes mellitus on gene expressions of mouse meibomian glands[J]. Curr Eye Res, 2020, 45(1):72-80. DOI: 10.1080/02713683.2019.1656750.
[23] Berbudi A, Rahmadika N, Tjahjadi AI, et al. Type 2 diabetes and its impact on the immune system[J]. Curr Diabetes Rev, 2020, 16(5):442-449. DOI: 10.2174/1573399815666191024085838.
[24] Rendra E, Riabov V, Mossel DM, et al. Reactive oxygen species (ROS) in macrophage activation and function in diabetes[J]. Immunobiology, 2019, 224(2):242-253. DOI: 10.1016/j.imbio.2018.11.010.
[25] Yoshida T, Yamagishi S, Nakamura K, et al. Pigment epithelium-derived factor (PEDF) ameliorates advanced glycation end product (AGE)-induced hepatic insulin resistance in vitro by suppressing Rac-1 activation[J]. Horm Metab Res, 2008, 40(9):620-625. DOI: 10.1055/s-0028-1083785.
[26] Ogata N, Matsuoka M, Imaizumi M, et al. Decrease of pigment epithelium-derived factor in aqueous humor with increasing age[J]. Am J Ophthalmol, 2004, 137(5):935-936. DOI: 10.1016/j.ajo.2003.08.058.
[27] Nien CJ, Paugh JR, Massei S, et al. Age-related changes in the meibomian gland[J]. Exp Eye Res, 2009, 89(6):1021-1027. DOI: 10.1016/j.exer.2009.08.013.
[28] Beauregard C, Brandt PC. Peroxisome proliferator-activated receptor agonists inhibit interleukin-1β-mediated nitric oxide production in cultured lacrimal gland acinar cells[J]. J Ocul Pharmacol Ther, 2003, 19(6):579-587. DOI: 10.1089/108076803322660495.
[29] Liu Y, Sheng MJ, Lin AJ, et al. Effect of hydrochloride pioglitazone on inflammation of lacrimal gland in MRL/lpr mice[J]. J Tongji Univ (Med Sci), 2013, 34(1):8-12. DOI: 10.3969/j.issn1008-0392.2013.01.002.
[30] Kim SW, Xie Y, Nguyen PQ, et al. PPARγ regulates meibocyte differentiation and lipid synthesis of cultured human meibomian gland epithelial cells (hMGEC)[J]. Ocul Surf, 2018, 16(4):463-469. DOI: 10.1016/j.jtos.2018.07.004.