·Clinical research·
Comparison of macular and choroidal capillary vessel density between untreated CSC and PCV and its significance
Yin Xinkai, Dai Rongping
Department of Ophthalmology, Peking Union Medical College Hospital, Key Laboratory of Ocular Fundus Diseases,Chinese Academy of Medical Sciences& Peking Union Medical College,Beijing 100730, China (Yin Xinkai was an on-the-job postgraduate of Peking Union Medical College Hospital and works at Shenzhen Aier Eye Hospital Affiliated to Jinan University, Shenzhen 518000, China)
Corresponding author: Dai Rongping, Email: derricka@sina.com
[Abstract] [View PDF in English] [View PDF in Chinese] [Read Full Text]
Objective To quantitatively analyze the retinal and choroidal vessel density in the macular region, the foveal avascular zone (FAZ) area, and other parameters in patients with untreated central serous chorioretinopathy (CSC) and polypoidal choroidal vasculopathy (PCV) using optical coherence tomography angiography. Correlations with retinal and choroidal thickness were also examined.
Methods In this cross-sectional study, 20 eyes of 20 patients with untreated CSC, 16 eyes of 16 patients with untreated PCV, and 19 eyes of 19 healthy people were enrolled from January 2018 to June 2021 in Shenzhen Aier Eye Hospital Affiliated to Jinan University. In all subjects, 6 mm×6 mm Optovue optical coherence tomography angiography scanning was carried out. The superficial retinal vessel density (SRVD), deep retinal vessel density (DRVD), outer retinal vessel density (ORVD), choroidal capillary vessel density (CCVD), FAZ area, FAZ perimeter, and vessel density in a 300-μm-wide annular region around the FAZ were measured by Optovue ReVue software. Pearson linear correlation analysis was used to evaluate the correlations among CFT, SFCT, retinal and choroidal vessel density, and FAZ-related parameters in CSC and PCV eyes. This study adhered to the Declaration of Helsinki. The protocol was approved by the Ethics Committee of Shenzhen Aier Eye Hospital Affiliated to Jinan University (No. AIERKY6236-1). Written informed consent was obtained before each subject was entered into the study groups.
Results There were significant differences in the foveal, parafoveal, and perifoveal SRVD among the three groups (F=6.344, 9.006, 5.617; all P<0.01). Compared with the healthy control group, the foveal, parafoveal, and perifoveal SRVD in the CSC group, as well as the foveal SRVD in the PCV group, were significantly higher (all P<0.01). Compared with the CSC group, the parafoveal and perifoveal SRVD were significantly lower in the PCV group (both P<0.01). There were significant differences in the parafoveal DRVD among the three groups (F=3.383, P<0.05). Compared with the healthy control group, the parafoveal DRVD of the CSC and PCV groups was higher (both at P<0.05). There were significant differences in the ORVD and CCVD among the three groups (F=16.931, 19.412; both P<0.001). Compared with the healthy control group, the ORVD and CCVD in the CSC group, and the CCVD in the PCV group, were significantly lower (all P<0.001). Compared with the PVC group, the ORVD was significantly lower in the CSC group (P<0.001). The CFT significantly differed among the three groups (F=20.495, P<0.001). Compared with the healthy control and PCV groups, the CFT was significantly higher in the CSC group (both P<0.001). There was no statistically significant difference in SFCT, FAZ area, FAZ perimeter, and vessel density of the 300-μm-wide annular region around the FAZ among the three groups (F=1.083, 0.906, 0.819, 1.530; all P>0.05). Parafoveal DRVD and ORVD were negatively correlated with CFT in the CSC group (r=-0.555, -0.516; both P<0.05), and ORVD and CFT were negatively correlated in the PCV group (r=-0.585, P<0.05). There were no statistically significant correlations between retinal and choroidal vessel density (SRVD, DRVD, ORVD, and CCVD), FAZ parameters (FAZ area, FAZ perimeter, and vessel density of the 300-μm-wideannular region around the FAZ), and SFCT in the three groups (all P>0.05).
Conclusions Superficial capillary hyperemia in the macular fovea and choroidal capillary atrophy may be the common pathogenesis in the early stages of CSC and PCV. The outer retinal vessel density is the main influencing factor of CFT changes in these two diseases.
Key words: Central serous chorioretinopathy (CSC); Optical coherence tomography angiography (OCTA); Polypoidal choroidal vasculopathy (PCV); Foveal avascular zone (FAZ); Vessel density
Fund program: The Non-profit Central Research Institute Fund of Chinese Academy of Medical Sciences (2018PT32029)
DOI: 10.3760/cma.j.cn115989-20211111-00623
Hypertrophic choroidal disease is a spectrum of diseases characterized by choroidal thickening and choroidal vasodilation. It is accompanied by various degrees of atrophy of the choroidal capillary layer, retinal pigment epithelium dysfunction, and choroidal neovascularization, and includes central serous chorioretinopathy (CSC) and polypoid choroidal vascular disease (PCV). These diseases are thought to have a common pathogenesis. Intraocular pressure, local choroidal osmotic pressure, choroidal venous pressure, number and size of choroidal capillary windowing deformities, abnormal function of the choroidal capillary-vitreous membrane-retinal pigment epithelial complex, uveoscleral shunt, and other factors may interact with each other, leading to the occurrence and development of the disease 1-10. The specific relationship between PCV and CSC has attracted increasing research attention 11-14. Similar choroidal vascular changes in eyes with PCV and CSC suggest a potential relationship between them. Optical coherence tomography angiography (OCTA) can not only objectively measure the vessel density of the retina, choroid, and foveal avascular zone (FAZ) area of the macular fovea, allowing the quantitative analysis of related indicators 15, but also clearly displays the abnormal branching vascular network and polypoid lesions in PCV. Previous studies have shown that changes in vessel density and the FAZ are related to the course and prognosis of some retinal diseases 16-23. Exploring the retinal choroidal vascular abnormalities of CSC and PCV is of great importance in revealing their pathological mechanisms and the relationship between them. To date, changes in the retinal choroidal hemodynamics of CSC and PCV have not been fully clarified, and there are still few relevant studies. The purpose of this study was to analyze the changes in retinal choroidal vessel density in the macular of patients with untreated monocular PCV and monocular CSC, and to explore their relationship with retinal thickness and choroidal thickness, in order to determine the correlation between the pathogenesis of CSC and PCV.
1 Materials and methods
1.1 General information
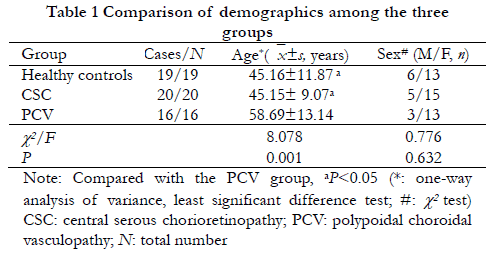
This cross-sectional study included 20 patients (20 eyes) with untreated monocular CSC and 16 patients (16 eyes) with monocular PCV patients diagnosed at Shenzhen Aier Eye Hospital affiliated to Jinan University between January 2018 and June 2021. At the same time, 19 eyes of 19 healthy controls were also analyzed. Comparison of baseline characteristics among the three groups is shown in Table 1. CSC diagnosis was based on multimodal imaging findings 24 and PCV diagnosis was based on EVEREST-2 research 25. Inclusion criteria for patients with CSC and PCV were as follows: (1) CSC or PCV confirmed by fluorescein fundus angiography, indocyanine green angiography, (ICGA) and OCT, (2) monocular disease, and (3) disease within 1 month of onset. Exclusion criteria for CSC and PCV patients comprised: (1) patient had received retinal interventional therapy, such as retinal laser photocoagulation, photodynamic therapy, glucocorticoid injection, or anti-vascular endothelial growth factor vitreous injection, etc., (2) occurrence of other eye diseases that may affect retinal and choroidal blood flow or vessel density measurement, including age-related macular degeneration, diabetic retinopathy, premacular membrane, high myopia (diopter >-6.0 D or axial length >26 mm), glaucoma, moderate or severe cataract, retinal detachment, or uveitis, etc., (3) previous history of vitreoretinal surgery, (4) choroidal neovascularization or cystoid macular degeneration secondary to other causes, (5) poor quality of OCTA images, such as PCV with interlamellar hemorrhage leading to local signal shadow, (6) diagnosed with systemic diseases that may affect fundus blood flow, such as diabetes, severe hypertension, and nephropathy, etc., and (7) poor patient condition rendering them unable to complete the examination. Inclusion criteria for healthy controls were as follows: (1) matched with age and sex in the CSC and PCV groups and (2) eye diseases excluded after systematic examination. Exclusion criteria for healthy controls comprised: (1) systemic diseases such as diabetes and hypertension, and (2) patient could not complete the examination. This study followed the Declaration of Helsinki and was approved by the Ethics Committee of Shenzhen Aier Eye Hospital affiliated to Jinan University (approval number: AIERKY6236-1). All patients understood the purpose and methods of the study, and voluntarily signed the informed consent form before being entered into the study groups.
1.2 Methods
1.2.1 Ophthalmic examination
Standardized medical history collection was taken at the first visit for all patients. The frequency domain OCT (Cirrus HD-OCT 4000, Carl Zeiss Meditec, USA) was used to scan a 6 mm×6 mm macular area, and the cross-sectional and B-mode images were observed. On the same day, the Heidelberg laser confocal imaging system (Spectralis HRA, Heidelberg Engineering, Germany) was used for fluorescein fundus angiography and indocyanine green angiography to observe abnormal manifestations of macular lesions.
1.2.2 Evaluating macular blood flow-related indexes using OCTA
The OCTA examinations were performed by the same experienced physician. The retinal blood flow in the 6 mm×6 mm region around the macula was imaged by the RTVue XR Avanti OCTA measuring instrument (Optovue, USA). The retinal blood flow in this area was automatically divided into four layers in en face mode as follows: (1) superficial layer of retina: between the outermost boundary of the internal limiting membrane and the inner plexiform layer, (2) deep layer of retina: between the outermost boundary of the inner plexiform layer and the outer plexiform layer, (3) outer layer of retina: between the outermost boundary of the outer plexiform layer and the retinal pigment epithelium (RPE), and (4) choroidal capillary layer: 10–20 μm below Bruch’s membrane.
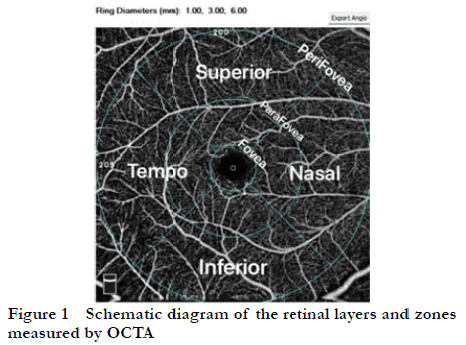
In the event of serous retinal detachment, subretinal fluid, serous pigment epithelial detachment, large branching vascular network, or polyps affecting the automatic slicing results in the OCTA, two experienced physicians would manually adjust and re-select the correct level, as well as exclude the image that could not be distinguished by blurred or compressed lesions. After determining the stratification of OCTA images, the capillary vessel density of each layer (blood flow signal area in selected area/selected area) was automatically generated based on the image binarization principle as follows: superficial retinal vessel density (SRVD), deep retinal vessel density (DRVD), outer retinal vessel density (ORVD), and choroidal capillary vessel density (CCVD). Among these, the values of SRVD and DRVD were automatically generated by the software by selecting the fovea area (with the fovea at the center radius within 0.5 mm), the parafovea area (with the fovea at the center radius and the annular area within 0.5–1.5 mm), and the perifovea area (an annular area within a radius of 1.5–3.0 mm with the fovea at the center) for quantitative analysis. The values of ORVD and CCVD were automatically generated by the software by selecting the area within 1 mm of the central radius of the fovea for quantitative analysis. FAZ parameters, including FAZ area, FAZ perimeter, and vessel density in the surrounding 300-μm-wide annular area (FD-300), were measured using the built-in software of the instrument. A schematic of the zoning and stratification of the above measurement areas is shown in Figure 1.
1.2.3 Evaluating choroidal thickness using OCTA
The macula was scanned horizontally and vertically using the RTVue XR Avanti OCTA measurement instrument (Optovue) in HD mode. The central foveal thickness (CFT) and subfoveal choroidal thickness (SFCT) were measured by two experienced physicians. CFT was defined as the distance between the internal limiting membrane and the inner surface of Bruch’s membrane. The CFT of each region was automatically measured by the OCTA inbuilt software when analyzing the vessel density of each region, and the CFT at the central concave were selected for analysis. SFCT was defined as the distance from the inner surface of Bruch’s membrane to the innermost choroidal-scleral interface. Since choroidal imaging is affected by lesions, in eyes with partial choroidal imaging shadow, the average choroidal thickness was taken at 500 μm, 1,000 μm, and 1,500 μm below the fovea, and at the nasal or temporal side of the fovea. If the imaging shadow of the choroid layer was obvious, it was judged as poor image quality and excluded.
1.3 Statistical analysis
SPSS 21.0 statistical software was used for the statistical analysis. The optical metrology data were confirmed to be normally distributed by the Shapiro–Wilk test and presented as x(_)±s. One-way analysis of variance was used to compare the overall differences in metrology among the CSC, PCV, and healthy control groups, and the least significant difference test was used for pairwise comparison between groups. The counting data were expressed by frequency, and the differences in data among different groups were compared by the χ2 test. Pearson correlation analysis was used to analyze the correlations of SRVD, DRVD, ORVD, CCVD, and FAZ parameters with CFT and SFCT. P<0.05 was considered statistically significant.
2 Results
2.1 Comparison of SRVD and DRVD among groups
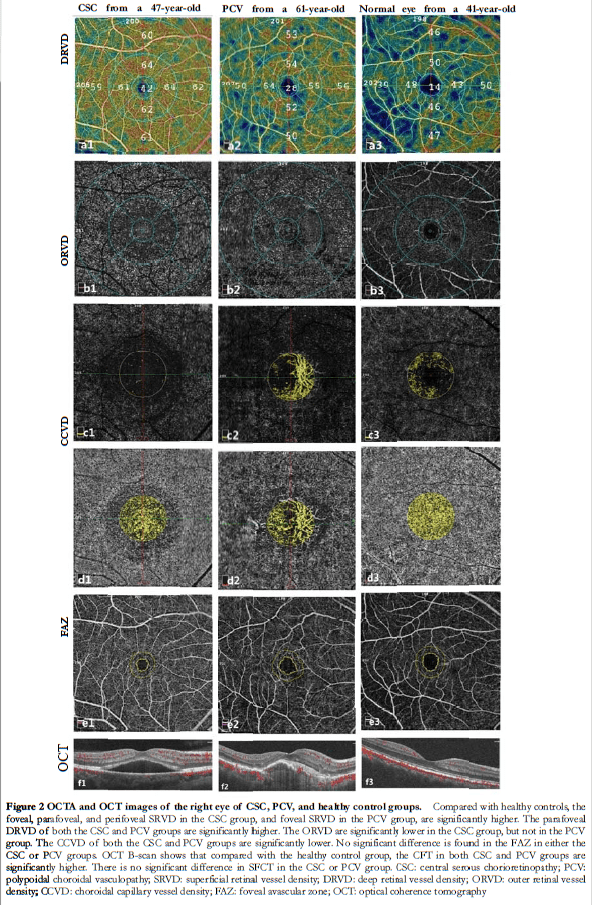
There were significant differences in the foveal, parafoveal, and perifoveal SRVD among the three groups (F=6.344, 9.006, 5.617; all P<0.01). Compared with the healthy control group, the foveal, parafoveal, and perifoveal SRVD in the CSC group, as well as the foveal SRVD in the PCV group, were significantly higher (all P<0.01). Compared with the CSC group, the parafoveal and perifoveal SRVD were significantly lower in the PCV group (both P<0.01). There was no significant difference in foveal SRVD between the CSC and PCV groups (P>0.05) (Figure 2, Table 2).
There were significant differences in parafoveal DRVD among the three groups (F=3.383, P<0.05), but there were no significant differences in the foveal and perifoveal DRVD (F =0.742, 2.947; all P>0.05). Compared with the healthy control group, the parafoveal DRVD of the CSC and PCV groups were significantly higher (both P<0.05). There was no significant difference in DRVD between the CSC and PCV groups (P>0.05) (Figure 2, Table 3).


2.2 Comparison of ORVD and CCVD among groups
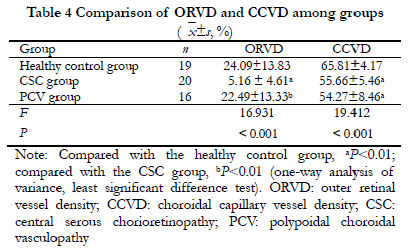
There were significant differences in the ORVD and CCVD among the three groups (F =16.931, 19.412; both P<0.001). Compared with the healthy control group, the ORVD and CCVD in the CSC group, and the CCVD in the PCV group, were significantly lower (all P<0.001). Compared with the PVC group, the ORVD was significantly lower in the CSC group (P<0.001) (Figure 2, Table 4).
2.3 Comparison of CFT and SFCT among groups
There was a significant difference in CFT among the three groups (F=20.495, P<0.001). Compared with the healthy control and PCV groups, the CFT was significantly higher in the CSC group (both P<0.001). No significant difference was found in SFCT among the three groups. (F=1.083, P>0.05) (Table 5).

2.4 Comparison of FAZ parameters among groups
There were no significant differences in SFCT, FAZ area, FAZ perimeter, or FD-300 among the three groups (F=0.906, 0.819, 1.530; all P>0.05) (Figure 2, Table 6).

2.5 Correlation of retinal and choroidal vessel density, and FAZ parameters, with CFT and SFCT in CSC and PCV groups
Parafoveal DRVD and ORVD were significantly negatively correlated with CFT in the CSC group (r=-0.555, -0.516; both P<0.05) (Figure 3), and there was a significant negative correlation between ORVD and CFT in the PCV group (r=-0.585, P<0.05) (Figure 3). There were no significant correlations between retinal and choroidal vessel density (SRVD, DRVD, ORVD, and CCVD), FAZ parameters (FAZ area, FAZ perimeter, and FD-300), and SFCT in the three groups (all P>0.05).

3 Discussion
This study investigated the pathogenesis of CSC and PCV to improve understanding of the occurrence and development of these diseases. The CCVD of the CSC and PCV groups was lower than that of the healthy control group, reflecting the attenuation of choroidal capillary vessel density in both CSC and PCV. In contrast, the SRVD of each region in both CSC and PCV groups was significantly higher compared with that of the healthy control group. This suggests that choroidal ischemia may occur in the early stage of these diseases, resulting in a compensatory increase of retinal vessel density to supply sufficient oxygen and nutrition to the retina.
A cross-sectional study by Luo et al. 26 used OCTA to evaluate changes in CCVD in the contralateral eyes of 38 patients with early monocular PCV and 36 patients with early monocular wet age-related macular degeneration, and compared these with 36 healthy controls. There was no significant difference in capillary vessel density reported between the PCV and healthy control groups. In the OCTA study of Roberta et al. 27, which included 40 eyes with CSC and 13 eyes of healthy controls, the SRVD, DRVD, and CCVD of the CSC group all showed attenuation of vessel density signals. Martins et al. 28 used OCTA to study the early and middle stages of age-related macular degeneration (30 eyes), PCV contralateral eye (7 eyes), and PCV (10 eyes), compared with a healthy control group (44 eyes). They found that the SRVD and CCVD in the PCV group were significantly lower than in the healthy control group, but there was no significant difference in DRVD. Yuan et al. 29 reported a significantly higher SRVD, DRVD, and CCVD in a CSC group compared to a PCV group, but did not compare these with healthy controls. Guo Jingli et al. 30 found that the SRVD and DRVD of a CSC group were significantly lower compared with a healthy control group. Yu et al. 31 reported that the SRVD and DRVD within a 3-mm area around the fovea in CSC eyes within 1 month of onset were significantly lower than in healthy controls, and both SRVD and DRVD were positively correlated with best corrected visual acuity. Mao et al. 16 divided a CSC group into acute and chronic stages, and observed that the SRVD and DRVD of CSC eyes in the acute stage did not change significantly compared with healthy controls.
There has been relatively few studies investigating the retinal and choroidal vessel density in patients with PCV and CSC, and they have mostly involved a small sample size, with results varying among them. Therefore, verification is required by multicenter and large sample studies in the future. All patients with CSC enrolled in the present study were consistent with the manifestations of the acute exacerbation phase; however, the retinal and choroidal vascular abnormalities in the chronic phase were not studied. In addition, for patients in the PVC group with large polyps and high pigment epithelial detachment, the OCTA inbuilt software system would have been blocked by the suprachoroidal lesions and produced a black area (with no blood flow signals). Therefore, all cases with an obvious macular shadow, and whose black area was over a quarter of the area analyzed were excluded. Furthermore, based on previous literature, the examining doctor manually adjusted the layer line until a relatively satisfactory CCVD analysis image was obtained 29-32.
Moreover, previous studies have involved different descriptions of SFCT changes in eyes with CSC and PCV. Yuan et al. 29 divided PCV into thick and thin choroid types. The proportion of Haller’s layer thickness of PCV and CSC was analyzed by binarization of subfoveal choroidal cross section images from enhanced depth imaging (EDI)-OCT. The results showed that the thickness ratio of Haller’s layer decreased from thick choroidal PCV to thin choroidal PCV and CSC. However, Imanaga et al. 33 observed 158 cases of CSC and found that the SFCT of CSC eyes with choroidal effusion was significantly thicker than in those without choroidal effusion. Venkatesh et al. 34 divided the SFCT-based data of 63 untreated PCV eyes in the EVEREST-2 study into three groups: thin, medium, and thick, and the demographics, clinical data, imaging features, and treatment results were analyzed and compared. Results showed that there was no significant difference in SFCT among the three groups, suggesting that the baseline choroid thickness of PCV eyes may vary widely. Ravenstijn et al. 35 found that SFCT in eyes with CSC with low myopia (diopter ≤-3.0 D) was significantly thinner than that in eyes with simple CSC.
Zhang et al. 36 analyzed the SFCT of 446 eyes from 230 healthy subjects to define the diagnostic value of the hypertrophic choroid. They found that there were significant differences in the distribution of hypertrophic choroid among different ages, indicating that age and diopter were independent influencing factors of SFCT. In the present study, the CFT of the CSC and PCV groups was significantly thicker than that of the healthy control group, but there was no significant difference in SFCT among the three groups. This may have been due to the small sample size and potential effect of differences in the age distribution. Age grouping should be considered when analyzing the influencing factors of SFCT measurements in eyes with CSC and PCV in the future. In addition, limited by the resolution of the instrument, the error between multiple SFCT measurements is large, even multiple measurements to obtain the mean value do not reduce the measurement error. Therefore, EDI-OCT inspection equipment should be updated in the future to achieve more accurate measurements of SFCT and increase the validity of findings on related influencing factors.
There have been relatively few studies investigating the correlation between retinal and choroidal vessel density, and FAZ-related parameters, measured by OCTA, and CFT and SFCT in eyes with CSC and PCV. Baek et al. 37 found the SFCT was positively correlated with choroidal vessel density in eyes with CSC and PCV, and the existence of choroidal hypertrophic vessels was closely related to a thicker SFCT and increased choroidal vessel density. In the present study, there was a negative correlation between DRVD, ORVD, and CFT in the fovea area of the eyes with CSC, and a negative correlation between ORVD and CFT in the eyes with PCV. The correlation between SFCT and the macular blood density of OCTA is not clear. Besides, simple CFT cannot reflect the degree of the lesion. In the future, quantifying the three-dimensional morphology of the lesion and calculating the proportion of the cross-sectional area of the lesion in EDI-OCT should be performed to comprehensively analyze the corresponding relationship between the lesion and vessel density. Moreover, Roberta et al. 27 reported six different morphological patterns in the choriocapillary layer and established more detailed grouping using newer OCTA equipment, which may be related to the different degrees of choroidal hyporeflection signals on OCTA images. Therefore, updating the inspection equipment can also further optimize the grouping, improve the SFCT measurement method, and reduce measurement errors. This will help to further clarify the correlation between OCTA-related measurement indicators and SFCT.
This study has some limitations. Due to its small-sample sample, it was not possible to observe the changes of OCTA during follow-up, and multiple equipment measurement verifications for the results were lacking. In addition, blood lipids, liver and kidney functions, and other factors may affect the fundus blood flow. In the future, it is necessary to increase the sample size, as well as optimize the inclusion and exclusion criteria. Furthermore, it is necessary to expand on the research of Zhang et al. 36 to further group patients with CSC and PCV, and healthy controls, based on different ages to achieve a more detailed stratification of multiple factors. At the same time, further follow-up should be performed to observe the OCTA characteristics, vessel density, and SFCT changes of eyes with CSC and PCV.
Conflict of interest All authors declare that there are no conflicts of interest.
Acknowledgements The authors would like to thank the Department of Ophthalmology, Shenzhen Aier Eye Hospital and the Key Laboratory of Ophthalmology, Chinese Academy of Medical Sciences for their guidance and assistance in this study.
Author contributions Yin Xinkai: participated in research design, subject recruitment, eye parameter measurement, data collection and analysis, and paper writing and revision; Dai Rongping: participated in topic selection, research design, data collection and analysis, paper revision, intellectual content revision, and final decision.
References
[1]Zhang XY, Lai XY. Paying attention to the concept and research of pachychoroid disease spectrum[J]. Chin J ExpOphthalmol, 2017, 35(5):385-390. DOI: 10.3760/cma.j.issn.2095-0160.2017.05.001.
[2]Chen YC, Chen SN. Three-year follow-up of choroidalneovascularisation in eyes of chronic central serous chorioretinopathy[J]. Br J Ophthalmol, 2020, 104(11):1561-1566. DOI: 10.1136/bjophthalmol-2019-315302.
[3]Yanagi Y. Pachychoroid disease: a new perspective on exudative maculopathy[J]. Jpn J Ophthalmol, 2020, 64(4):323-337. DOI: 10.1007/s10384-020-00740-5.
[4]Maruko I, Iida T, Sugano Y, et al. Subfovealchoroidal thickness in fellow eyes of patients with central serous chorioretinopathy[J]. Retina, 2011, 31(8):1603-1608. DOI: 10.1097/IAE.0b013e31820f4b39.
[5]Chung YR, Kim JW, Kim SW, et al. Choroidal thickness in patients with central serous chorioretinopathy: assessment of Haller and Sattler layers[J]. Retina, 2016, 36(9):1652-1657. DOI: 10.1097/IAE.0000000000000998.
[6]Sonoda S, Sakamoto T, Kuroiwa N, et al. Structural changes of inner and outer choroid in central serous chorioretinopathy determined by optical coherence tomography[J/OL]. PLoS One, 2016, 11(6):e0157190[2022-01-02]. http://www.ncbi.nlm.nih.gov/pubmed/27305042. DOI: 10.1371/journal.pone.0157190.
[7]Ferrara D, Mohler KJ, Waheed N, et al. En face enhanced-depth swept-source optical coherence tomography features of chronic central serous chorioretinopathy[J]. Ophthalmology, 2014, 121(3):719-726. DOI: 10.1016/j. ophtha.2013.10.014.
[8]Cheung C, Lee WK, Koizumi H, et al. Pachychoroid disease[J]. Eye (Lond), 2019, 33(1):14-33. DOI: 10.1038/s41433-018-0158-4.
[9]Yanagi Y, Ting D, Ng WY, et al. Choroidal vascular hyperpermeability as a predictor of treatment response for polypoidal choroidal vasculopathy[J]. Retina, 2018, 38(8):1509-1517. DOI: 10.1097/IAE.0000000000001758.
[10]Kim JY, Son WY, Kim RY, et al. Recurrence and visual prognostic factors of polypoidal choroidal vasculopathy: 5-year results[J/OL]. Sci Rep, 2021, 11(1):21572[2022-01-10]. http://www.ncbi.nlm.nih.gov/pubmed/34732787. DOI: 10.1038/ 41598-021-00904-4.
[11]Dansingani KK, Balaratnasingam C, Naysan J, et al. En face imaging of pachychoroid spectrum disorders with swept-source optical coherence tomography[J]. Retina, 2016, 36(3):499-516. DOI: 10.1097/IAE.0000000000000742.
[12]Sakurada Y, Fragiotta S, Leong B, et al. Relationship between choroidal vascular hyperpermeability, choriocapillaris flow density, and choroidal thickness in eyes with pachychoroid pigment epitheliopathy[J]. Retina, 2020, 40(4):657-662. DOI: 10.1097/IAE.0000000000002635.
[13]Lehmann M, Bousquet E, Beydoun T, et al. Pachychoroid: an inherited condition?[J]. Retina, 2015, 35(1):10-16. DOI: 10.1097/IAE.0000000000000287.
[14]Wang TA, Chan WC, Tsai SH, et al. Clinical features of pachyvessels associated with polypoidal choroidal vasculopathy in chronic central serous chorioretinopathy[J/OL]. Sci Rep, 2021, 11(1):13867[2022-01-16]. http://www.ncbi.nlm.nih.gov/pubmed/34230584. DOI: 10.1038/s41598-021-93476-2.
[15]Wang Q, Chan S, Yang JY, et al. Vascular density in retina and choriocapillaris as measured by optical coherence tomography angiography[J]. Am J Ophthalmol, 2016, 168:95-109. DOI: 10.1016/j.ajo.2016.05.005.
[16]Mao J, Lin J, Zhu L, et al. Quantitative assessment of retinal capillary vessel density and foveal avascular zone area in central serous chorioretinopathy using OCTA[J]. Ophthalmologica, 2020, 243(5):370-378. DOI: 10.1159/000504053.
[17]Li L, Almansoob S, Zhang P, et al. Quantitative analysis of retinal and choroid capillary ischaemia using optical coherence tomography angiography in type 2 diabetes[J]. ActaOphthalmol, 2019, 97(3):240-246. DOI: 10.1111/aos.14076.
[18]Nelis P, Alten F, Clemens CR, et al. Quantification of changes in foveal capillary architecture caused by idiopathic epiretinal membrane using OCT angiography[J]. Graefe’s Arch ClinExpOphthalmol, 2017, 255(7):1319-1324. DOI: 10.1007/s00417-017-3640-y.
[19]Lee H, Lee M, Chung H, et al. Quantification of retinal vessel tortuosity in diabetic retinopathy using optical coherence tomography angiography[J]. Retina, 2018, 38(5):976-985. DOI: 10.1097/IAE.0000000000001618.
[20]Dursun ME, Erdem S, Karahan M, et al. Evaluation of parafoveal vascular density using optical coherence tomography angiography in patients with central serous chorioretinopathy[J]. Lasers Med Sci, 2022, 37(2):1147-1154. DOI: 10.1007/s10103-021-03366-2.
[21]Jordan-Yu JM, Teo K, Chakravarthy U, et al. Polypoidal choroidal vasculopathy features vary according to subfovealchoroidal thickness[J]. Retina, 2021, 41(5):1084-1093. DOI: 10.1097/IAE.0000000000002966.
[22]Chang YC, Cheng CK. Difference between pachychoroid and nonpachychoroidpolypoidal choroidal vasculopathy and their response to anti-vascular endothelial growth factor therapy[J/OL]. Retina, 2020, 40(7):1403-1411[2022-01-28]. http://www.ncbi.nlm.nih.gov/pubmed/31181038. DOI: 10.1097/IAE.0000000000002583.
[23]Ma ST, Huang CH, Chang YC, et al. Clinical features and prognosis of polypoidal choroidal vasculopathy with different morphologies of branching vascular network on optical coherence tomography angiography[J/OL]. Sci Rep, 2021, 11(1):17848[2022-01-28]. http://www.ncbi.nlm.nih.gov/pubmed/34497317. DOI: 10.1038/s41598-021-97340-1.
[24]Fujimoto H, Gomi F, Wakabayashi T, et al. Morphologic changes in acute central serous chorioretinopathy evaluated by fourier-domain optical coherence tomography[J]. Ophthalmology, 2008, 115(9):1494-1500. DOI: 10.1016/j.ophtha. 2008.01.021.
[25]Koh A, Lee WK, Chen LJ, et al. EVEREST study: efficacy and safety of verteporfin photodynamic therapy in combination with ranibizumab or alone versus ranibizumab monotherapy in patients with symptomatic macular polypoidal choroidal vasculopathy[J]. Retina, 2012, 32(8):1453-1464. DOI: 10.1097/IAE. 0b013e31824f91e8.
[26]Luo M, Zhao X, Zhao N, et al. Comparison of choriocapillary flow density between fellow eyes of polypoidal choroidal vasculopathy and neovascular age-related macular degeneration[J/OL]. BMC Ophthalmol, 2020, 20(1):162[2022-08-06]. http://www.ncbi.nlm.nih.gov/pubmed/32321472. DOI: 10.1186/s12886-020-01386-0.
[27]Roberta F, Arturo C, Maurizio F. Optical coherence tomography angiography of central serous chorioretinopathy: quantitative evaluation of the vascular pattern and capillary flow density[J]. Graefe’s Arch Clin Exp Ophthalmol, 2022, 260(3): 1015-1024. DOI: 10.1007/s00417-021-05306-w.
[28]Martins A, Farinha C, Raimundo M, et al. Multimodal evaluation of the fellow eye of patients with retinal angiomatous proliferation[J]. Ophthalmic Res, 2018, 59(2):88-97. DOI: 10.1159/000481262.
[29]Yuan MZ, Chen LL, Yang JY, et al. Comparison of OCT and OCTA manifestations among untreated PCV, neovascular AMD, and CSC in Chinese population[J]. Int J Ophthalmol, 2020, 13(1):93-103. DOI: 10.18240/ijo.2020.01.14.
[30]Guo JL, Ding XY, Wu HX, et al. The features of optical coherence tomography angiography in acute central serous chorioretinopathy eyes[J]. Chin J Ocul Fundus Dis, 2017, 33(5):494-497. DOI: 10.3760/cma.j.issn.1005-1015.2017.05.013.
[31]Yu L, Shao Y, Chai Y, et al. Retinal microvasculature alteration in central serous chorioretinopathy[J]. Mol Med Rep, 2018, 17(2):2335-2340. DOI: 10.3892/mmr.2017.8126.
[32]Kim JH, Kang SW, Kim JR, et al. Variability of subfovealchoroidal thickness measurements in patients with age-related macular degeneration and central serous chorioretinopathy[J]. Eye (Lond), 2013, 27(7):809-815. DOI: 10.1038/eye.2013.78.
[33]Imanaga N, Terao N, Sawaguchi S, et al. Clinical factors related to loculation of fluid in central serous chorioretinopathy[J]. Am J Ophthalmol, 2022, 235:197-203. DOI: 10.1016/j.ajo.2021.09.009.
[34]Venkatesh R, Gadde S, Pereira A, et al. Impact of sub-foveal choroidal thickness on clinical features and long-term clinical outcomes in polypoidal choroidal vasculopathy[J]. IntOphthalmol, 2021, 41(1):87-97. DOI: 10.1007/s10792-020- 01555-6.
[35]Ravenstijn M, van Dijk E, Haarman A, et al. Myopic presentation of central serous chorioretinopathy[J]. Retina, 2021, 41(12):2472-2478. DOI: 10.1097/IAE. 0000000000003297.
[36]Zhang XY,Qiu BJ,Wang YH, et al. Distribution characteristics of choroidal thickness in normal population and the diagnostic cut-off value for pachychoroid[J]. Chin J ExpOphthalmol, 2022, 40(6):548-555. DOI: 10.3760/cma.j.cn115989- 20220401-00127.
[37]Baek J, Lee JH, Jung BJ, et al. Morphologic features of large choroidal vessel layer: age-related macular degeneration, polypoidal choroidal vasculopathy, and central serous chorioretinopathy[J]. Graefe’s Arch ClinExpOphthalmol, 2018, 256(12):2309-2317. DOI: 10.1007/s00417-018-4143-1.