Authors:Zhang Yue, Li Jiayu, Zhai Xinran, Yao Yao, Li Liyan, Xiao Zhe, Chen Han, Pang Wu, Yang Zanzhang, Zhang Minglian
Corresponding author:Zhang Minglian, Email:zhmlyk@163.com
Published:2026-08-10
DOI:10.3760/cma.j.cn115989-20250521-00166
ABSTRACT
Objective To investigate the role and mechanism of haptoglobin (HP) in regulating retinal vascular barrier function and inflammatory response in diabetic macular edema (DME).
Methods Aqueous humor samples were collected from 7 patients with non-proliferative diabetic retinopathy (NPDR) and 7 patients with DME. Liquid chromatography-tandem mass spectrometry (LC-MS/MS) was used for proteomic analysis to identify differentially expressed proteins. The target protein was screened out through protein-protein interaction analysis and biological function analysis using the STRING database. Aqueous humor samples were collected from patients with simple cataract ( n=23), NPDR ( n=23), and DME ( n=23), and HP expression levels were determined by enzyme-linked immunosorbent assay (ELISA). In addition, 42 healthy male SD rats aged 8-10 weeks were randomly divided into control, diabetes, diabetes+empty vector, and diabetes+HP lentivirus groups using the random number table method. Rats in the control group received citrate buffer, while those in the other groups received streptozotocin to establish diabetes mellitus model. At 8 weeks after modeling, the diabetes+empty vector group and diabetes+HP lentivirus group received intravitreal injections of empty vector and HP lentivirus, respectively. One week post-injection, retinal vascular leakage was assessed by calculating the Evans blue/retina weight ratio. Quantitative PCR was performed to detect the relative mRNA expression levels of interleukin (IL)-1β, IL-2, IL-6, tumor necrosis factor-α (TNF-α), and high mobility group box 1 (HMGB1) in the rat retinas. Immunofluorescence staining was used to detect the number of F4/80-positive cells. Part of this study on human samples complied with the Declaration of Helsinki and the study protocol was approved by the Ethics Committee of the Hospital of Hebei Eye Hospital (No. 2024LW30). All participants fully understood the study protocol and purpose and signed the informed consent form. The feeding and use of experimental animals adhered to the 3Rs alternatives, Regulations for the Administration of Affairs Concerning Experimental Animals and Laboratory Animal-Guideline for Ethical Review of Animal Welfare. The animal experimental study protocol was approved by the Animal Experimental Ethics Committee of Hebei Eye Hospital (No. 2024LW31).
Results Proteomic analysis identified 425 quantifiable proteins, of which 84 showed significant differences between the DME and NPDR groups. HP was identified as a hub protein among the differentially expressed proteins, with a higher functional enrichment related to the regulation of inflammatory response. ELISA results showed that HP expression levels in the simple cataract, NPDR, and DME groups were (5.878±0.462), (6.118±0.215), and (6.769±0.245)ng/ml, respectively, with a statistically significant overall difference ( F=36.47, P<0.0001). The HP expression level in the DME group was significantly higher than that in the simple cataract and NPDR groups (both P<0.05). ROC curve analysis demonstrated that HP had high diagnostic accuracy for DME (AUC=0.986, P<0.001), with an HP level above 6.5 ng/ml in aqueous humor suggesting the possible development of DME in NPDR patients. The retinal vascular leakage ratios in the diabetes and diabetes+HP lentivirus groups were significantly higher than that in the control group, while the leakage ratio in the diabetes+HP lentivirus group was significantly lower than that in the diabetes group (all P<0.05). The mRNA expression levels of IL-1β, IL-2, IL-6, TNF-α, and HMGB1 in the retina of the diabetes group were significantly higher than those in the control group, while those in the diabetes+HP lentivirus group were significantly lower than those in the diabetes and diabetes+empty vector groups (all P<0.05). Immunofluorescence staining showed that the number of F4/80-positive cells was significantly increased in the diabetes group compared with the control group, whereas it was markedly decreased in the diabetes+HP lentivirus group compared with the diabetes group.
Conclusions HP is significantly upregulated in the aqueous humor of DME patients and the retinas of diabetic rats, potentially participating in retinal inflammatory response and vascular barrier dysfunction through the HMGB1 signaling pathway. Downregulation of HP ameliorates retinal vascular leakage and inflammatory response, suggesting that HP may be a potential therapeutic target for DME.
KEYWORDS:
Diabetic macular edema;Haptoglobin;High mobility group box 1;Proteomics;Retinal vascular barrier;Inflammatory response
COPYRIGHTS:
Copyright by Chinese Medical Association
No content published by the journals of Chinese Medical Association may be reproduced or abridged without authorization. Please do not use or copy the layout and design of the journals without permission.
All articles published represent the opinions of the authors, and do not reflect the official policy of the Chinese Medical Association or the Editorial Board, unless this is clearly specified.
Authors Info & Affiliations
Zhang Yue
Hebei Eye Hospital, Hebei Key Laboratory of Ophthalmology, Hebei Clinical Research Center for Eye Diseases, Xingtai 054001, China
Li Jiayu
Department of Ophthalmology, Hebei Medical University, Hebei Eye Hospital, Hebei Key Laboratory of Ophthalmology, Hebei Clinical Research Center for Eye Diseases, Xingtai 054001, China
Zhai Xinran
Hebei Eye Hospital, Hebei Key Laboratory of Ophthalmology, Hebei Clinical Research Center for Eye Diseases, Xingtai 054001, China
Yao Yao
Hebei Eye Hospital, Hebei Key Laboratory of Ophthalmology, Hebei Clinical Research Center for Eye Diseases, Xingtai 054001, China
Li Liyan
Hebei Eye Hospital, Hebei Key Laboratory of Ophthalmology, Hebei Clinical Research Center for Eye Diseases, Xingtai 054001, China
Xiao Zhe
Hebei Eye Hospital, Hebei Key Laboratory of Ophthalmology, Hebei Clinical Research Center for Eye Diseases, Xingtai 054001, China
Chen Han
Hebei Eye Hospital, Hebei Key Laboratory of Ophthalmology, Hebei Clinical Research Center for Eye Diseases, Xingtai 054001, China
Pang Wu
Hebei Eye Hospital, Hebei Key Laboratory of Ophthalmology, Hebei Clinical Research Center for Eye Diseases, Xingtai 054001, China
Yang Zanzhang
Hebei Eye Hospital, Hebei Key Laboratory of Ophthalmology, Hebei Clinical Research Center for Eye Diseases, Xingtai 054001, China
Zhang Minglian
Hebei Eye Hospital, Hebei Key Laboratory of Ophthalmology, Hebei Clinical Research Center for Eye Diseases, Xingtai 054001, China
Figures & Tables
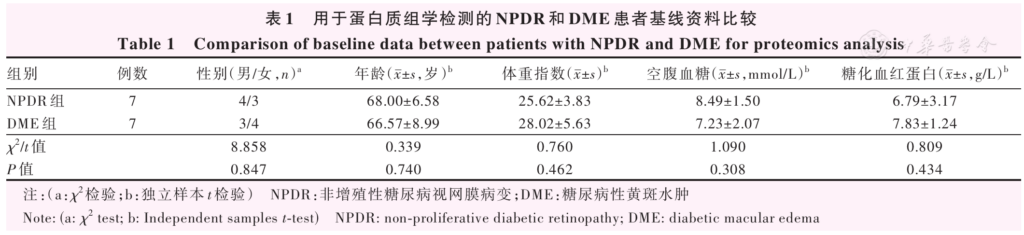
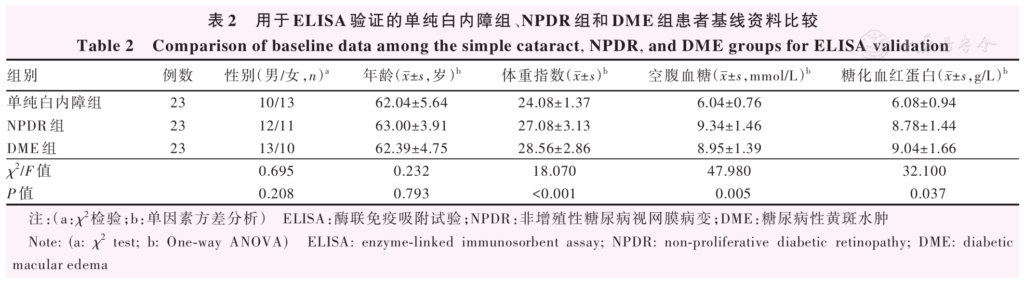
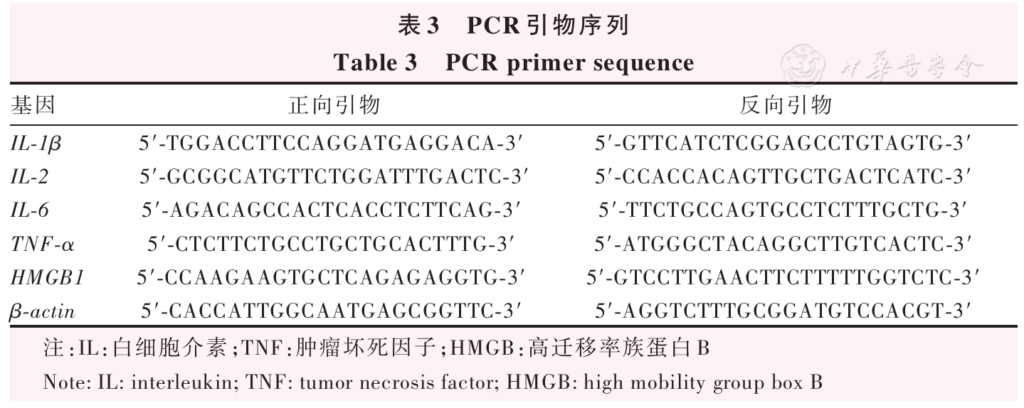
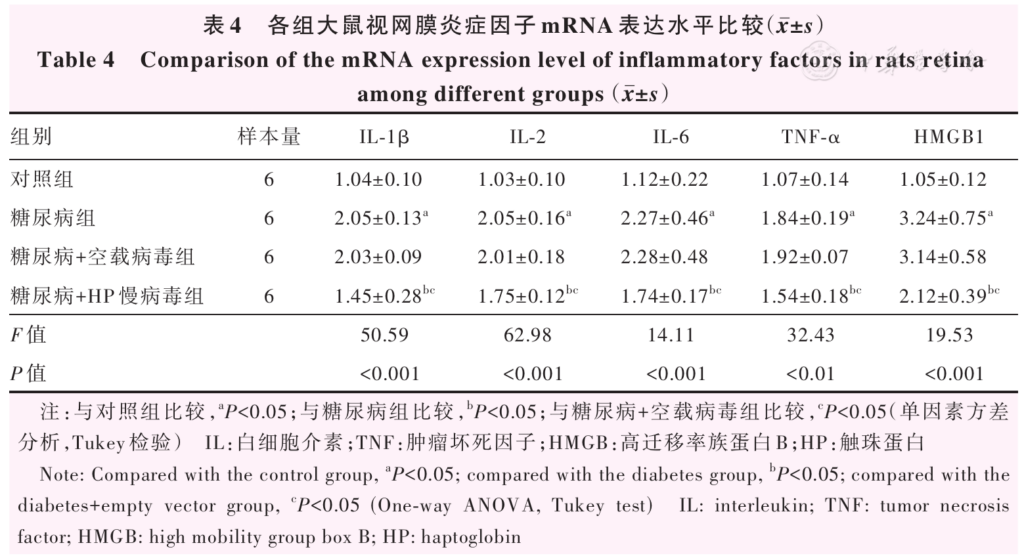
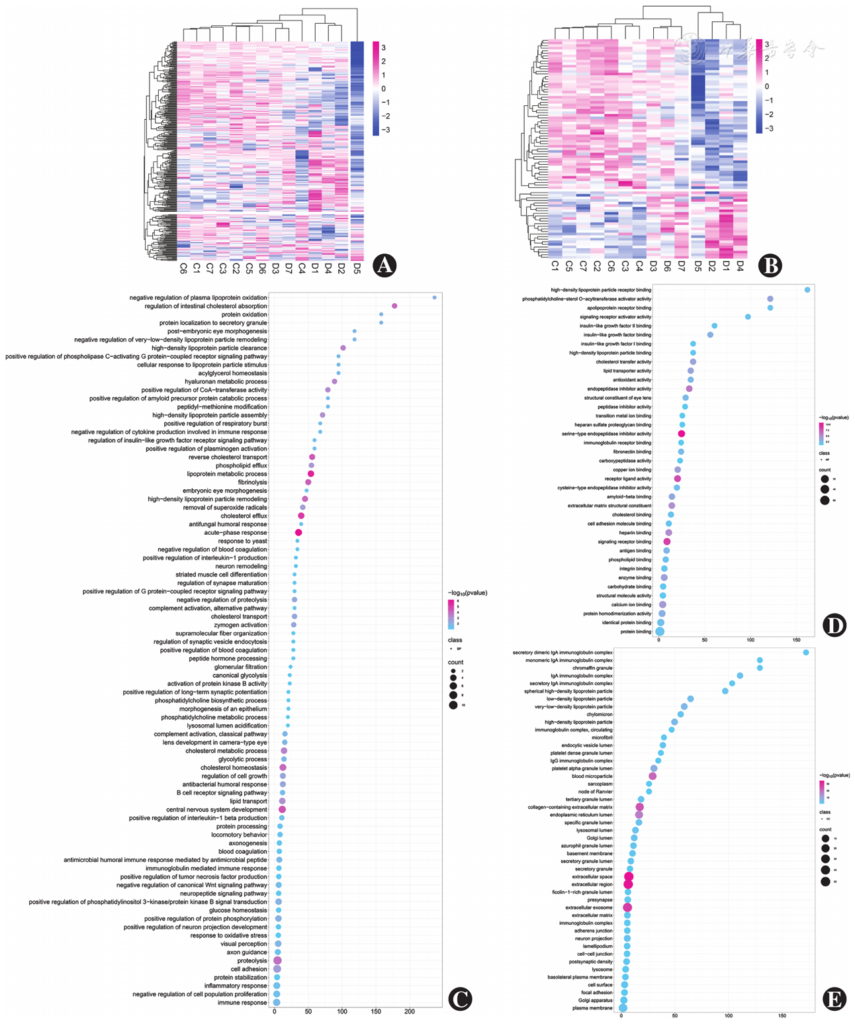
Figure 1 Quantitative proteomic results of aqueous humor samples from patients with NPDR and DME A: Heatmap of total quantified proteins C represented the NPDR group and D represented the DME group B: Heatmap of differentially expressed proteins with statistically significant differences Images A and B were adapted from PMID: 37981180 [ 17 ] C: Gene Ontology biological process enrichment analysis of differentially expressed proteins D: Molecular function enrichment analysis of differentially expressed proteins E: Cellular component enrichment analysis of differentially expressed proteins NPDR: non-proliferative diabetic retinopathy; DME: diabetic macular edema
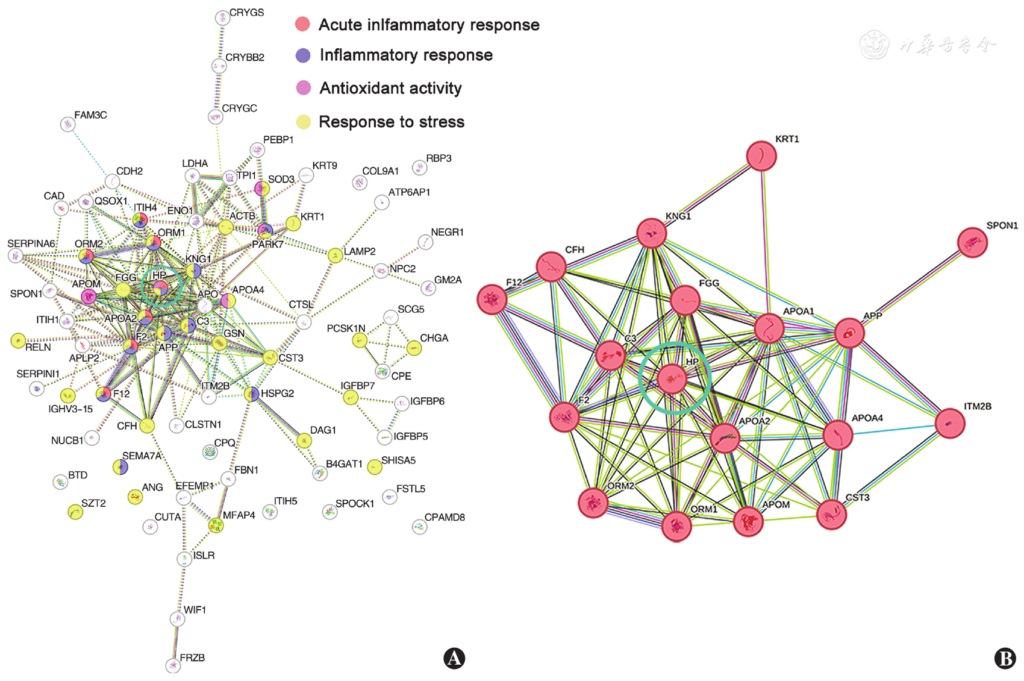
Figure 2 Protein-protein interaction analysis of differentially expressed proteins in aqueous humor samples from NPDR and DME patients based on STRING database A: Interaction network of differentially expressed proteins Each circle represented a differentially expressed protein, and the connecting lines indicated potential interactions between two proteins. Different colors represented the molecular functions enriched for each protein, including acute inflammatory response, inflammatory response, antioxidant activity, and stimulus response B: Correlation analysis of differentially expressed proteins enriched in inflammatory response The proteins circled in green represented the hub proteins (target proteins) NPDR: non-proliferative diabetic retinopathy; DME: diabetic macular edema
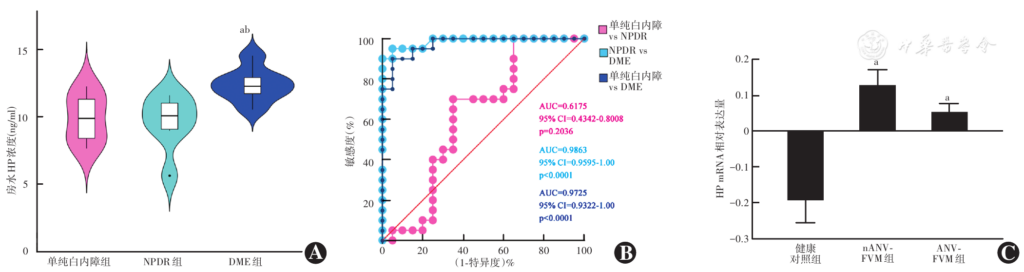
Figure 3 Comparison of HP expression levels among groups A: Comparison of aqueous humor HP expression levels among the simple cataract, NPDR, and DME groups F=36.47, P<0.001. Compared with the simple cataract group, aP<0.05; compared with the NPDR group, bP<0.05 (One-way ANOVA, Tukey test; n=23) B: ROC curves of aqueous humor HP for distinguishing the simple cataract, NPDR, and DME groups C: Comparison of HP expression levels among the healthy control, nANV-FVM, and ANV-FVM groups F=5.26, P<0.05. Compared with the healthy control group, aP<0.05 (One-way ANOVA, Tukey test; n=3) HP: haptoglobin; NPDR: non-proliferative diabetic retinopathy; DME: diabetic macular edema; ROC: receiver operating characteristic; AUC: area under the curve; CI: confidence interval; nANV: inactive neovascularization; FVM: fibrovascular membrane; ANV: active neovascularization
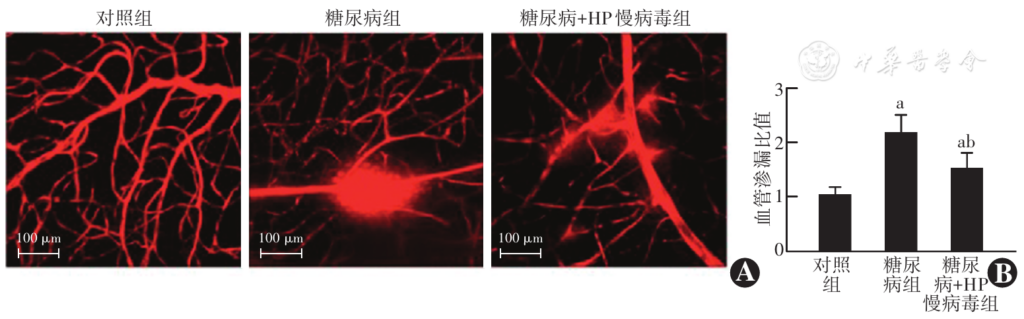
Figure 4 Comparison of rats retinal leakage among different groups A: Representative images of Evans blue staining in each group (×200, scale bar=100 μm) B: Comparison of vascular leakage ratios among groups F=30.56, P<0.05. Compared with the control group, aP<0.05; compared with the diabetes group, bP<0.05 (One-way ANOVA, Tukey test; n=3) HP: haptoglobin
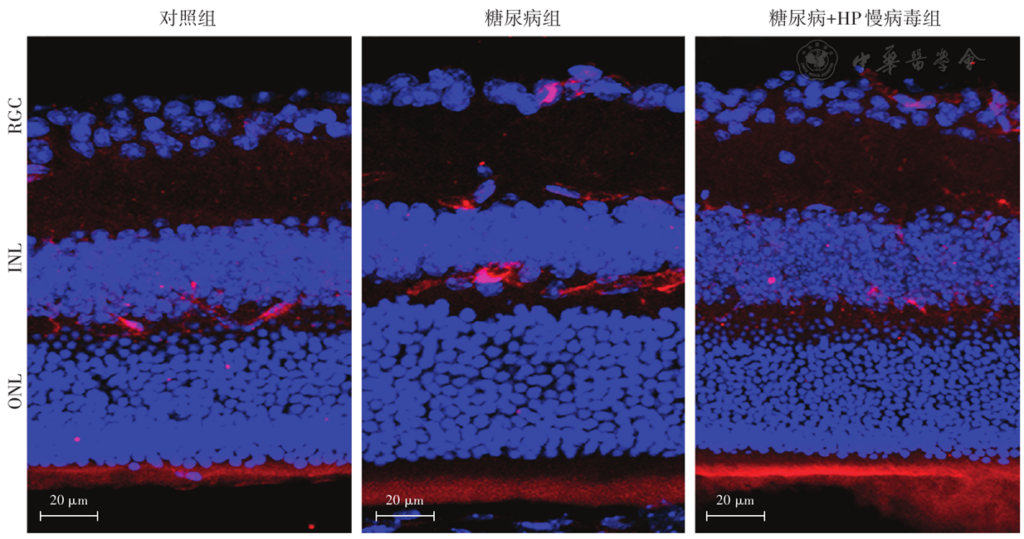
Figure 5 F4/80 immunofluorescence staining results of retina in control group, diabetes group and diabetes+HP lentivirus group (DAPI ×200; scale bar=20 μm) The number of F4/80-positive cells was significantly increased in the diabetes group compared with the control group, whereas it was markedly decreased in the diabetes+HP lentivirus group compared with the diabetes group HP: haptoglobin; RGL: retinal ganglion cell; INL: inner nuclear layer; ONL: outer nuclear layer
References click to collapse