·Experimental Research·
Protective effects of tert-butylhydroquinone on retinal structure, function and mechanism in early diabetic rat models
Wang Juan1, Wei Fang2, Cao Yang1, Tian Min1, Lyu Hongbin1
1Department of Ophthalmology, the Affiliated Hospital of Southwest Medical University, Luzhou 646000, China; 2Department of Ophthalmology, Shanghai General Hospital, Shanghai Jiao Tong University School of Medicine, Shanghai 200080, China
Corresponding author: Lyu Hongbin, Email: oculistlvhongbin@163.com
[Abstract] [View PDF in English] [View PDF in Chinese] [Read Full Text]
Objective To investigate the protective effects of an antioxidant tert-butyl hydroquinone (tBHQ) on the morphology and function of retina in early-stage experimental diabetic rats, and to explore the mechanism of its protective effect. Methods: Forty-five healthy SD rats of clean degree were randomized into normal control group, diabetes model group and tBHQ intervention group, with 15 rats in each group according to a random number table. The diabetes model was established via a single intraperitoneal injection of streptozotocin (STZ) in diabetes model group and tBHQ intervention group. Normal control group was intraperitoneally administered with an equal-volume injection of sodium citrate buffer. Rats in the tBHQ intervention group maintained a diet with 1% tBHQ for 2 weeks before the STZ injection, and the other two groups were fed with normal rat food only. Blood from tail vein was collected to assay the blood glucose at 72 hours, 2 weeks and 4 weeks following modeling. Rat electroretinogram (ERG) was detected at 4 weeks after modeling. Morphological changes of rat retina were observed by hematoxylin and eosin staining. The apoptosis of retinal cells in different layers was detected by TUNEL assay. The expression of protein kinase B (Akt), p-Akt, endothelial nitric oxide synthase (eNOS) and p-eNOS was detected by Western blot. Müller line rMC-1 cell cultured in vitro was divided into 5 groups, including normal control group (72-hour culturing in normal medium), mannitol control group (72-hour culturing in medium containing 5.5 mmol/L glucose & 24.5 mmol/L mannitol), high glucose group (72-hour culturing in high-glucose medium), tBHQ intervention group (24-hour culturing in normal-glucose medium containing 5 μmol/L tBHQ+72-hour culturing in high-glucose medium containing 5 μmol/L tBHQ), and phosphoinositide 3-kinase (PI3K) inhibitor group (6-hour culturing im mormal medium containing 5 μmol/L LY294002+24-hour culturing in normal-glucose medium containing 5 μmol/L LY294002 & 5 μmol/L tBHQ+72-hour culturing in high-glucose medium containing 5 μmol/L LY294002 & 5 μmol/L tBHQ). The expression of Akt, p-Akt, eNOS and p-eNOS of cells were detected by western blot. The use and care of animals complied with Regulations for the Administration of Laboratory Animals in China and Southwest Medical University. The study protocol was approved by the Animal Ethics Committee of Southwest Medical University (No. 201711189).
Results The blood glucose at 72 hours, 2 weeks and 4 weeks after modeling was higher in diabetic model group than tBHQ intervention group and normal control group (all at P<0.05). Four weeks after modeling, the scotopic ERG a-wave and b-wave amplitudes of diabetic model group were lower than those of normal control group and tBHQ intervention group (all at P<0.05). With edema and thickening of inner plexiform layer, thinning inner nuclear layer and outer nuclear layer, as well as loosely arrangement and disorder of structure, the number of retinal ganglion cells was decreased in diabetic model group than normal control group, all of which were improved in tBHQ intervention group than diabetic model group. The apoptosis index in diabetic model group was higher than normal control group and tBHQ intervention group (both at P<0.05), which mainly existed in the outer nuclear layer. The relative expressions of p-Akt/Akt and p-eNOS/eNOS in rat retina of normal control group, diabetic model group and tBHQ intervention group were 0.76±0.11 and 0.83±0.06, 0.52±0.10 and 0.52±0.08, 1.14±0.31 and 1.03±0.13, respectively. The relative expressions of p-Akt/Akt and p-eNOS/eNOS in diabetic model group were lower than those of normal control group and tBHQ intervention group (all at P<0.01). The relative expressions of p-Akt/Akt and p-eNOS/eNOS in normal glucose group, mannitol control group, high glucose group, tBHQ intervention group and PI3K inhibitor group was 0.95±0.38 and 0.86±0.11, 0.94±0.27 and 0.74±0.29, 0.33±0.25 and 0.45±0.29, 1.32±0.37 and 1.28±0.22, 0.24±0.09 and 0.73±0.29, respectively. The relative expressions of p-Akt/Akt and p-eNOS/eNOS were significantly lower in high glucose group than those in normal glucose group and tBHQ intervention group (all at P<0.05), which were significantly lower in PI3K inhibitor group compared to tBHQ intervention group (both at P<0.01).
Conclusions tBHQ has protective effects on the morphology and function of retina in early diabetic rats, and the mechanism may be related to the activation of Akt/eNOS signaling pathway.
[Key words] Diabetes mellitus/complications; Retinopathy; Antioxidants/tert-butylhydroquinone; Electroretinogram; Apoptosis; Akt/eNOS
Fund program: Shanghai Critical Laboratory for Fundus Diseases (030105); Sichuan Health and Health Committee Research Project (18035); Science and Technology Strategic Cooperation Program of Luzhou Municipal People’s Government and Southwest Medical University (2017LZXNYD-J01)
DOI: 10.3760/cma.j.cn115989-20191225-00555
Diabetic retinopathy (DR) is a common microvascular complication of diabetes mellitus. Early prevention and treatment are imperative for preventing blindness in DR1. Studies have shown that retinal nerve damage in diabetic rats precedes vascular damage2. Furthermore, clinical studies have confirmed that the b-wave and oscillatory potentials of the electroretinogram (ERG) of patients with diabetes decrease in amplitude before the development of structural changes in the retina, and the ERG amplitude decreases further as the disease is exacerbated and prolonged. In addition, the latency period is prolonged3, which indicates that retinal nerve function is abnormal in patients with diabetes at an early stage. Therefore, early protection and restoration of retinal neuronal function in DR are important to prevent DR blindness. Tert-butylhydroquinone (tBHQ) (molecular formula: C10 H14 O2) is a synthetic phenolic antioxidant, often used as a food additive to prevent oxidative deterioration of fatty foods; furthermore, it is a phase II enzyme inducer that can effectively prevent oxidative stress-induced cellular dysfunction4. Studies have shown that tBHQ promotes protein kinase B (Akt) phosphorylation by activating the phosphoinositide 3-kinase (PI3K) pathway5. Moreover, phosphorylated Akt and its activation pathway can exert anti-apoptotic and anti-oxidative stress effects on neurodegenerative diseases such as Alzheimer’s disease6, confirming a role for tBHQ in neuronal protection. In DR, the PI3K/Akt pathway is inhibited and involved in high glucose-induced retinal cell damage7, and restoring the activity of the PI3K/Akt pathway plays a key role in preventing and treating DR. Previous findings suggest that tBHQ can play a role in resisting endothelial impairment and endothelial nitric oxide synthase (eNOS) uncoupling by promoting the activation of eNOS, a downstream target protein of Akt8; however, whether tBHQ can restore diabetes-induced eNOS activity remains unknown. In this study, we aimed to establish an animal diabetes model and a cellular hyperglycemia model to observe the effects of tBHQ on retinal structure and function in early DR and investigate its mechanism of action.
1 Material and Methods
1.1 Materials
1.1.1 Experimental animals In total, 45 clean-grade male SD rats (8-week-old), with body masses of 180–200 g, were purchased from Shanghai Siple-Bikai Laboratory Animal Co. The housing environment included 12 h/12 h light/dark cycles, a temperature of 22–25 °C, and humidity of 40%–70%. The experimental animals were housed, used, and executed in accordance with the National and Southwest Medical University regulations on experimental animal management, and the study protocol was reviewed and approved by the Experimental Animal Ethics Review Committee of Southwest Medical University (approval number: 201711189).
1.1.2 Experimental cells The rat retinal Müller cell line rMC-1 (Vijay Sarthy Laboratory, Northwestern University, USA) was used. Cells were cultured in Dulbecco’s Modified Eagle Medium (DMEM) containing 10% fetal bovine serum (FBS) in a culture environment with a volume fraction of 5% CO2, saturated humidity, and a temperature of 37 °C. When the cells were cultured to 80%-90% fusion, the cells were passaged, and the 3rd–8th generation cells were used for the experiment.
1.1.3 Main reagents and instruments The following reagents were used: tBHQ, streptozocin (STZ) (Sigma, USA); PI3K inhibitor LY294002 (Merck, USA); sugar-free DMEM medium (Gibco, USA); RIPA lysate, protein loading buffer, ultrasensitive enhanced chemiluminescence (ECL) reagent, primary antibody and secondary antibody dilution (Shanghai Biyuntian Biotechnology Co. enhanced chemiluminescence (ECL) reagents, primary antibody and secondary antibody dilutions (Shanghai Biyuntian Biotechnology Co., Ltd.); mouse anti-rat eNOS antibody (ab76198, Abcam, USA); rabbit anti-rat p-eNOS ser1179 antibody (12454-2, SAB, USA); rabbit anti-rat p-Akt ser473 (4060s), rabbit anti-rat Akt (4685s), β-actin, HRP-labeled monoclonal antibodies (5125s) (CST, USA); TUNEL apoptosis detection kit (Roche, Switzerland). In addition, the following instruments were used: ganzfeld ERG System (Phoenix- Micron, USA); NANO DROP spectrophotometer (Thermo Fisher Scientific, USA); Laser scanning confocal fluorescence microscope (TCS SP8, Leica, Germany).
1.2 Methodology
1.2.1 Animal grouping and model establishment Forty-five rats were divided into normal control, diabetic model, and tBHQ intervention groups according to the random number table method, with 15 rats in each group. After 1 week of adaptive feeding, rats in the diabetic model and tBHQ intervention groups received intraperitoneal (IP) injections with a mass fraction of 1% STZ solution (6.5 ml/kg) to establish the diabetic rat model. In the normal control group, rats were injected intraperitoneally with an equal volume of sodium citrate buffer. The rats in the normal control and diabetic model groups were fed normal chow (Shanghai Fanbo Biotechnology Co., Ltd.), while the tBHQ intervention group was fed with 1% mass fraction of tBHQ-added chow (Shanghai Fanbo Biotechnology Co., Ltd.) for 2 weeks before STZ injection. At 72 h after modeling, fasting plasma glucose (FPG) was measured by blood sampling from the tail vein of rats, and FPG > 16.7 mmol/L was considered successful modeling.
1.2.2 Cell grouping and model establishment The Müller cell lines were divided into five groups, in which the normal control cells were cultured in a medium containing 5.5 mmol/L glucose for 72 h; the mannitol control cells were cultured in a medium containing 5.5 mmol/L glucose and 24.5 mmol/L mannitol for 72 h; the high sugar group cells were cultured in medium containing 30 mmol/L glucose; the tBHQ intervention group cells were pretreated in normal sugar medium containing 5 µmol/L tBHQ for 24 h and then continued to be cultured in high sugar medium containing 5 µmol/L tBHQ for 72 h. Moreover, the cells in the PI3K inhibitor group were pretreated in a normal sugar medium containing 5 µmol/L LY294002 for 6 h and then in high sugar medium containing 5 µmol/L LY294002 and 5 μmol/L LY294002 for 72 h. The cells in the PI3K inhibitor group were pretreated in a normal sugar medium containing 5 μmol/L LY294002 and 5 μmol/L tBHQ for 6 h and then incubated in a normal sugar medium containing 5μmol/L LY294002 and 5 µmol/L tBHQ for 24 h. The medium was changed every day, and the experiment was repeated five times.
1.2.3 ERG detection of retinal function 4 weeks after modeling Rats with diabetic cataracts were excluded, and six rats from each group were selected and dark-adapted for at least 12 h. The rats were anesthetized using IP injection of chloral hydrate (3 ml/kg) at a mass fraction of 10%. The pupils were fully dilated with compound tropicamide drops, fixed in the prone position on the experimental table, and kept warm. The Ganzfeld ERG system was used to record the dark-adapted retinal responses. Electrodes were installed: the corneal electrode was placed perpendicular to the corneal apex to fully contact the cornea and allow light to fully enter the eye; the reference electrode was placed subcutaneously at the intersection of the posterior occipital sagittal suture and the line connecting the two eyes; the grounding electrode was placed subcutaneously at the dorsal aspect of the caudal root. According to the pre-experimental results, the stimulation conditions were set as follows: the background light intensity was 0 cd/m2; the flash intensities were –1.3, –0.3, and 0.7 cd-s/m2, the stimulation intervals were 30, 40, and 50 s; the duration of a single stimulation was 10 µs. Each light intensity was recorded five times to obtain the average value, and the above steps were repeated for the other eye. All experiments were performed under weak red-light irradiation. The data were recorded, and the differences in the ERG a-wave and b-wave amplitudes were analyzed for each group of rats under different stimulation light intensities.
1.2.4 Observation of retinal tissue morphology and structure by hematoxylin-eosin staining Four weeks after modeling, five rats from each group were anesthetized with 10% chloral hydrate (3 ml/kg) intraperitoneally, and the right eye was fixed in 4% paraformaldehyde solution by a mass fraction for 24 h. Conventional paraffin embedding was performed in 5 µm-thick continuous sections parallel to the direction of the optic nerve. The retinal tissues of each group were 1) paraffin-sectioned, dewaxed, hydrated in xylene I, II, and gradient ethanol; 2) stained with hematoxylin for 3–5 min; 3) soaked in 1% hydrochloric acid ethanol solution for 5 s and returned to blue in 1% ammonia by volume for 5 s; 4) dehydrated in gradient ethanol for 5 min each; 6) re-stained in 0.5% eosin solution by volume for 5 min; 7) sealed with neutral resin after dehydration and transparency in anhydrous ethanol, and observed and photographed under a light microscope.
1.2.5 Apoptosis of retinal tissue by TUNEL method Four weeks after modeling, five rats in each group were anesthetized using 10% chloral hydrate (IP) (3 ml/kg) and executed. The right eyes were fixed in 4% paraformaldehyde solution for 24 h and the frozen sections were routinely prepared in the direction of the optic nerve in 12 μm-thick continuous sections. The retinal frozen sections of each group were air-dried at room temperature, fixed in 4% paraformaldehyde at room temperature for 20 min according to the instructions, washed with phosphate buffer saline (PBS) for 30 min, permeabilized with 0.1% Triton X-100 at 4 °C for 2 min, washed with PBS, and the prepared TUNEL assay mixture was added dropwise onto the sections. Furthermore, the sections were incubated at 37 °C for 1 h. DAPI was used to restore the nuclei, and PBS was used to seal the sections with an anti-fluorescence quenching sealer. When red fluorescence coincided with the nucleus, the cells were considered apoptotic. Whole retinal images were analyzed using ImageJ software, and the total number of cells on each image and the number of positive TUNEL-stained cells were recorded.
1.2.6 Detection of p-Akt, Akt, eNOS, and p-eNOS protein expression in retinal tissues and cells by western blotting The left eyes of 10 rats in each group were taken, and the lens was removed by cutting along the corneoscleral rim to isolate the retinal tissues. The cells in each group were collected at the same time, frozen, and stored in a refrigerator at –80 °C. Protein was extracted from retinal tissues and cells using RIPA lysis solution, and protein concentration was detected by NANO DROP software. Protein samples were prepared by boiling them with a loading buffer. Each group of protein samples was sampled at 30 μg in a 7.5% mass fraction SDS-PAGE gel lane, electrophoresed at 80–120 V for 1.5 h, and transferred to a polyvinylidene difluoride (PVDF) membrane in an ice bath at a constant current of 0.36 A for 1.5 h. The PVDF membrane was placed in Tris-Buffered Saline (TBST) containing a 5% mass fraction of skim milk powder and shaken at room temperature for 1.5 h. The TBST was rinsed three times, each time for 15 min, and the membranes were cut according to the size of protein molecules. In addition, anti-eNOS (1:200), p-eNOS (1:200), p-Akt (1:1,000), Akt (1:1,000), and β-actin (1:1,000) primary antibodies were added and incubated overnight at 4 °C. In addition, after washing the membranes three times in TBST, HRP-labeled secondary antibodies (1:5,000) were added and incubated for 1.5 h at room temperature on a shaker. The relative expression level of each protein was calculated using the ImageJ software to determine the grayscale value of each band, with β-actin as the internal reference.
1.3 Statistical Analysis
Statistical analysis was performed using the GraphPad Prism software (version 8.0). The data were normally distributed as confirmed by the W test and expressed as x ± s. The overall differences between groups of rats and cytometric data were compared using a one-way analysis of variance (ANOVA), and a two-way comparison between groups was performed using the LSD-t-test. In addition, P<0.05 was considered a statistically significant difference.
2 Results
2.1 Comparison of general conditions and blood glucose concentrations at different time points after modeling in each group of rats
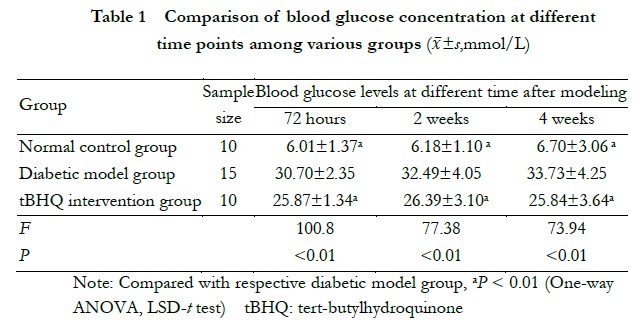
Five model rats with substandard blood glucose levels were removed from the experiment. Finally, 25 rats were successfully modeled, 15 in the diabetic model group and 10 in the tBHQ intervention group, and no deaths occurred during the feeding process. At 72 h after modeling, the rats in the diabetic model group began to show changes in increased urination and drinking, and as the disease prolonged, the rats exhibited coarse and yellow hair, depression, unresponsiveness, and obvious symptoms of polyphagia, polyphagia, and polyphagia. However, the tBHQ intervention group rats showed fewer symptoms of polyphagia, polyphagia, and polyphagia compared to the diabetic model group, with a better mental condition and a certain degree of coarse and yellow hair. Rats in the control group had smooth hair, good mental health, and responsiveness. The overall differences in the blood glucose concentrations between the groups at 72 h, 2 weeks, and 4 weeks after modeling were statistically significant (F=100.80, P<0.001; F=77.38, P<0.001; F=73.94, P<0.001, respectively). In addition, the blood glucose levels of the rats in the diabetes model group were higher at 72 h, 2 weeks, and 4 weeks after modeling than those in the normal control and tBHQ intervention groups, and the differences were statistically significant (all P<0.05) (Table 1).
2.2 Comparison of ERG amplitudes among groups of rats
When the stimulation light intensity was –1.3 log cd-s/m2 and –0.3 log cd-s/m2, the overall difference between the a- and b-wave amplitudes of the dark-adapted ERG in each group was not statistically significant (all P>0.05). In contrast, when the stimulation light intensity was 0.7 log cd-s/m2, the overall difference between the a- and b-wave amplitudes of the dark-adapted ERG in each group was statistically significant (F=4.51, P=0.03; F=5.21, P=0.02). Furthermore, the a- and b-wave amplitudes of the dark-adapted ERG in the diabetic model group were significantly lower than those in the normal control and tBHQ intervention groups, and the differences were statistically significant (all P<0.05) (Table 2).

2.3 Comparison of retinal structures among groups of rats
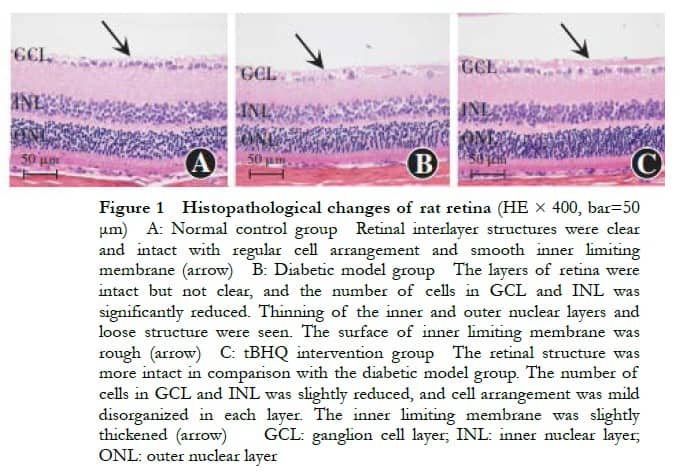
Under an optical microscope, the structure of all layers of the retina in the normal control group was clear and intact; furthermore, the surface of the inner boundary membrane was smooth, and the cells were neatly arranged. In the diabetic model group, the retinal structure was still intact but not clear, with intercellular edema, rough inner boundary membrane surface, significantly reduced number of cells in the ganglion cell layer, thinning of the inner and outer nuclear layers, loose structure, and disordered cell arrangement. The tBHQ intervention group had a more intact retinal structure, mild thickening of the inner boundary membrane, mild reduction of cells in the ganglion cell layer, loose structure of the inner nuclear layer and outer nuclear layer, and mild disordered cell arrangement (Figure 1). In the tBHQ intervention group, the retinal tissue was intact, the inner boundary membrane was slightly thickened, ganglion cells were slightly reduced, the inner and outer nuclei were looser, and the cell arrangement was slightly disorganized (Figure 1).
2.4 Comparison of apoptosis in the retinal tissue of rats in each group
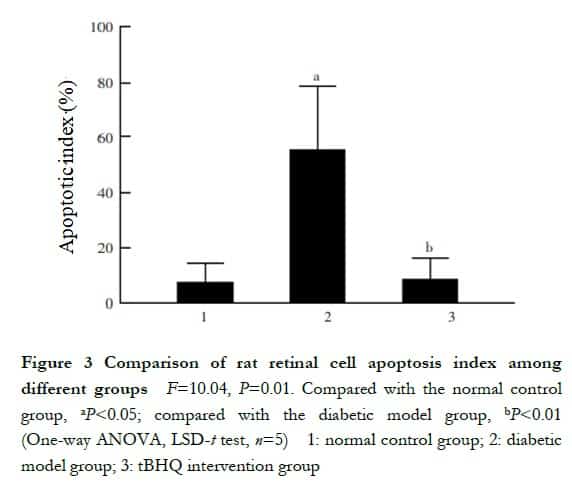
A small number of TUNEL red fluorescent-stained apoptotic cells were seen in all layers of the retina of the normal control group; the number of red fluorescent-stained cells in the retina of the rats was more in the diabetic model group than in the normal control group and were mainly located in the outer nuclear layer. In the tBHQ intervention group, the number of red fluorescent-stained cells in the retina of the rats as less than that in the diabetic model group (Figure 2). The apoptosis indices were (7.63±6.49) %, (55.26±26.63)%, and (8.59±7.98)% in the normal control, diabetes model, and tBHQ intervention groups, respectively, with statistically significant differences in the overall comparison (F=10.04, P=0.01). In addition, all the differences were statistically significant (P=0.02, <0.01) (Figure 3).

2.5 Comparison of protein expression in retinal tissues and cells of rats in each group
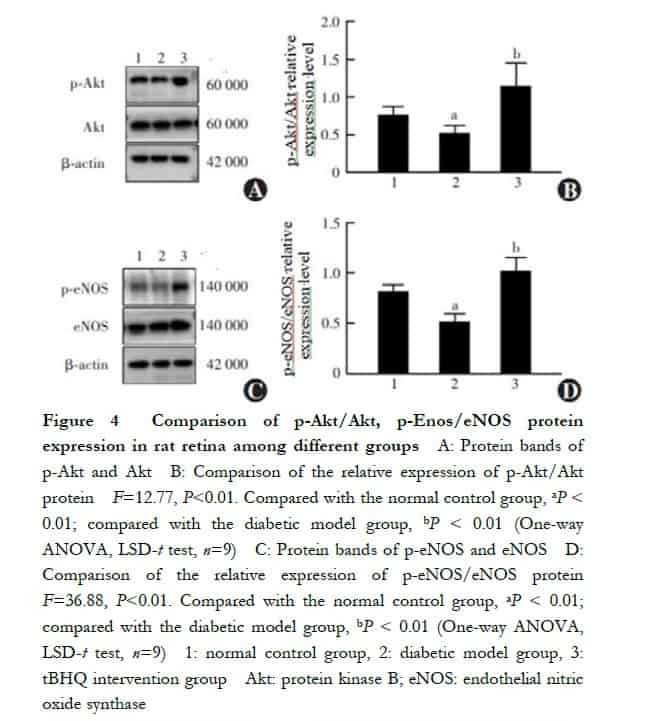
The relative expression levels of p-Akt/Akt and p-eNOS/eNOS in the retinal tissues of rats in the normal control, diabetes model, and tBHQ intervention groups were 0.76±0.11, 0.52±0.10, and 1.14±0.31, respectively, and the relative p-eNOS/eNOS expression level was 0.83±0.06, 0.52±0.08, and 1.03±0.13, respectively, and the overall comparison was also statistically significant (F=12.77, P<0.01; F=36.88, P<0.01); compared with normal control rats, the relative expression levels of p-Akt/Akt and p-eNOS/eNOS in the retinal tissues of rats in the diabetic model group were reduced, and the differences were all statistically significant (both P<0.01). Compared with the diabetes model group, the relative expression levels of p-Akt/Akt and p-eNOS/eNOS in the retinal tissues of rats in the tBHQ intervention group were significantly increased, and the differences were statistically significant (all P<0.01) (Figure 4). The relative p-Akt/Akt expression level in cells of normal control, mannitol control, high glucose, tBHQ intervention, and PI3K inhibitor groups was 0.95±0.38, 0.94±0.27, 0.33±0.25, 1.32±0.37 and 0.24±0.09, respectively, and the relative p-eNOS/eNOS expression level was 0.86±0.11, 0.74±0.29, 0.45±0.29, 1.28±0.22 and 0.73±0.29, respectively, with statistically significant differences in the overall comparison (F=12.36, P<0.01; F=7.35, P<0.01). Compared with normal controls, the relative expression levels of p-Akt/Akt and p-eNOS/eNOS were significantly lower in the cells of the high glucose group than in the normal control group, and the differences were all statistically significant (both P = 0.02); the relative expression levels of p-Akt/Akt and p-eNOS/eNOS were significantly higher in the cells of the tBHQ intervention group than in the high glucose group, and the differences were all statistically significant (both P < 0.01); compared with the tBHQ intervention group, the PI3K inhibitor group had a significantly higher relative p-Akt expression level. The relative expression levels of p-Akt/Akt and p-eNOS/eNOS were significantly lower in the PI3K inhibitor group than in the tBHQ intervention group, and the differences were statistically significant (all P<0.01) (Figure 5).

3 Discussion
Previous studies have shown that tBHQ has a protective effect on the retina of STZ-induced diabetic rat models, and to some extent, reduces blood glucose levels in model rats and increases the expression of anti-apoptotic and anti-oxidative stress factors, such as HO-1 and Bcl-2, in retinal tissues9-10. The results of this study also showed that the blood glucose level of tBHQ-treated diabetic rats was significantly lower than that of the diabetic model group, confirming that tBHQ has an anti-hyperglycemic effect, and the mechanism may be that tBHQ exerts a protective effect on the pancreatic β cells of diabetic model rats. Furthermore, tBHQ-treated diabetic model rats secrete more insulin, thus, achieving an anti-hyperglycemic effect11.
Clinical studies have shown that patients with DR have abnormal retinal function prior to the development of fundus microangiopathy12, mainly in the form of reduced color vision, contrast sensitivity, dark adaptation, and ERG with reduced amplitude and prolonged latency13. Animal studies have also shown that retinal function is impaired in diabetic rats prior to vasculopathy14. The ERG a- and b-waves are mainly derived from retinal photoreceptor cells (cone and rod cells) and bipolar cells, reflecting the potential changes when the cells are stimulated. The results of the present study showed that compared with the normal control group, the ERG in the diabetic model rats showed abnormalities at 4 weeks after modeling—mainly in the a- and b-wave amplitudes—indicating that the ERG amplitude decreased in the STZ-induced diabetic rats at an early stage. This is consistent with the findings of Chesler et al15. who found visual dysfunction in the diabetic model rats at an early stage. There is evidence that tBHQ has a potential protective effect on cortical and motor neurons in neurodegenerative lesions16. In this study, the ERG’s a-wave and b-wave amplitudes were higher in the tBHQ intervention group than in the diabetic model group. It is speculated that tBHQ may improve retinal function in diabetic model rats to some extent, and this effect may be produced by tBHQ through the protection of retinal nerve cells in diabetic rat models.
Moreover, the histopathological staining in this study showed that the outer and inner nuclear layers of the retina of the rats in the diabetic model group were thinned and the cell arrangement was disturbed. Additionally, TUNEL staining showed that the apoptotic cells in the retina of the rats in the diabetic model group were mainly located in the outer nuclear layer, the photoreceptor cells and bipolar cells were damaged, and the number of cells was reduced. In contrast, the retinas of the rats in the tBHQ intervention group were improved, indicating that tBHQ had a protective effect against both structural and neural cell damage in the retinas of diabetic rats. The morphological and structural characteristics of the retinal tissue and apoptosis in each group were consistent with the changes in ERG a- and b-wave amplitudes.
High glucose-induced oxidative stress is considered a key mechanism leading to the onset and progression of DR17. Therefore, various proteins or cytokines that inhibit the oxidative stress response have an active role in preventing the progression of DR. eNOS, one of the enzymes that catalyze NO synthesis in the body, plays an important role in the pathogenesis of DR. Under pathological conditions, eNOS-derived NO reacts with the superoxide anion (O2- ) to form peroxynitrite (ONOO- ), which induces oxidative stress in cells and then apoptosis, while enhancing vascular permeability18. Many oxidation products can lead to uncoupling and inactivation of eNOS, resulting in a vicious cycle of oxidative stress19. In this study, we found that phosphorylated eNOS expression level was decreased in the retinal tissue of diabetic model rats and in cells cultured with high glucose, suggesting the presence of eNOS inactivation in the high glucose state, which may mediate the structural and functional damage to the retina caused by high glucose levels during DR. In addition, elevated phosphorylated eNOS expression was found in the retinas of diabetic rats treated with tBHQ or in cells with high glucose levels. Chen et al20. showed that phosphorylation of the eNOS ser1179 site increased the affinity of eNOS for cofactors (L-arginine, BH4), improved eNOS uncoupling under pathological conditions, and reduced eNOS inactivation, suggesting that tBHQ plays a role in promoting or restoring eNOS activity, thereby exerting anti-apoptotic and anti-oxidative stress effects on retinal neurons.
The upstream signaling pathway PI3K/Akt of eNOS mediates a variety of human diseases, including cancer, diabetes, cardiovascular disease, and neurological disorders21-22. Previous studies have shown that phosphorylation of the Akt ser473 site stimulates the full enzymatic activity of Akt, achieving regulatory effects by inhibiting pro-apoptotic proteins (e.g., Bad) or inhibiting pro-apoptotic signaling (Foxo)23. In the pathogenesis of DR, the PI3K/Akt pathway is inhibited, the level of Akt phosphorylation is significantly reduced, and the downstream apoptotic cascade response is activated, causing oxidative stress damage and apoptosis in retinal neurons24. In the present study, phosphorylated Akt expression level was reduced in the retinal tissue of diabetic rats and cells cultured with high glucose, whereas phosphorylated Akt expression level was elevated in the retinas of diabetic rats with tBHQ intervention or in cells with high glucose, suggesting that tBHQ may exert a protective effect on the retina in DR by promoting the phosphorylation of the Akt protein ser473 locus and activating Akt. Further investigation of the mechanism of the protective effect of tBHQ revealed that the expression levels of phosphorylated Akt and phosphorylated eNOS were decreased in the PI3K inhibitor group compared with those in the tBHQ intervention group, indicating that the promotion of Akt and eNOS phosphorylation by tBHQ could be blocked by PI3K inhibitors; however, the exact mechanism requires further investigation.
In conclusion, the results of this study suggest that tBHQ may protect retinal structure and function in early diabetic rat models through the PI3K-activated Akt/eNOS pathway, providing a theoretical basis for tBHQ and its derivatives to prevent and treat retinal damage in DR, which is important for the prevention and treatment of early DR. However, because of the complexity of retinal structure and cellular diversity, no experiments on retinal intercellular interactions were performed in this study, and direct evidence of tBHQ via Akt-mediated phosphorylation of eNOS ser1179 is still lacking and needs to be further explored in subsequent studies.
Conflict of interest None declared.
Authors contribution Wang Juan: Proposal, study design, operation, data collection, statistical analysis, manuscript writing and revision; Wei Fang: Proposal, operation and supervision; Cao Yang, Tian Min: Proposal, study design and supervision; Lyu Hongbin: Proposal, supervision, manuscript revision and final decision
References
[1] Hendrick AM, Gibson MV, Kulshreshtha A. Diabetic retinopathy[J]. Prim Care, 2015, 42(3):451-464. DOI: 10.1016/j.pop.2015.05.005.
[2] Antonetti DA, Barber AJ, Bronson SK, et al. Diabetic retinopathy: seeing beyond glucose-induced microvascular disease[J]. Diabetes, 2006, 55(9):2401-2411. DOI: 10.2337/db05-1635.
[3] Srinivasan S, Sivaprasad S, Rajalakshmi R, et al. Early retinal functional alteration in relation to diabetes duration in patients with type 2 diabetes without diabetic retinopathy[J/OL]. Sci Rep, 2022, 12(1):11422[2022-07-26]. http://www.ncbi.nlm.nih.gov/pubmed/35794201. DOI: 10.1038/s41598-022-15425-x.
[4] Gharavi N, Haggarty S, El-Kadi AO. Chemoprotective and carcinogenic effects of tert-butylhydroquinone and its metabolites[J]. Curr Drug Metab, 2007, 8(1):1-7. DOI: 10.2174/138920007779315035.
[5] Zhu TT, Zhu CN, Qiu Y, et al. Tertiary butylhydroquinone alleviated liver steatosis and increased cell survival via β-arrestin-2/PI3K/AKT pathway[J]. Iran J Basic Med Sci, 2021, 24(10):1428-1436. DOI: 10.22038/IJBMS.2021.58156.12924.
[6] Li H, Kang T, Qi B, et al. Neuroprotective effects of ginseng protein on PI3K/Akt signaling pathway in the hippocampus of D-galactose/AlCl3 inducing rats model of Alzheimer’s disease[J]. J Ethnopharmacol, 2016, 179:162-169. DOI: 10.1016/j.jep.2015.12.020.
[7] Huang X, Liu G, Guo J, et al. The PI3K/AKT pathway in obesity and type 2 diabetes[J]. Int J Biol Sci, 2018, 14(11):1483-1496. DOI: 10.7150/ijbs.27173.
[8] Luo Z, Aslam S, Welch WJ, et al. Activation of nuclear factor erythroid 2-related factor 2 coordinates dimethylarginine dimethylaminohydrolase/PPAR-γ/endothelial nitric oxide synthase pathways that enhance nitric oxide generation in human glomerular endothelial cells[J]. Hypertension, 2015, 65(4):896-902. DOI: 10.1161/HYPERTENSIONAHA.114.04760.
[9] Li B, Liu S, Miao L, et al. Prevention of diabetic complications by activation of Nrf2: diabetic cardiomyopathy and nephropathy[J/OL]. Exp Diabetes Res, 2012, 2012:216512[2021-08-12]. http://www.ncbi.nlm.nih.gov/pubmed/22645602. DOI: 10.1155/2012/216512.
[10] Tian M, Zhang SY, Han PY, et al. tBHQ activates Nrf2 signaling pathways to enhance retinal protection in type 2 diabetic rats[J]. Rec Adv Ophthalmol, 2017, 37(3):220-224. DOI:10.13389/j.cnki.rao.2017.0056.
[11] Nishizono S, Hayami T, Ikeda I, et al. Protection against the diabetogenic effect of feeding tert-butylhydroquinone to rats prior to the administration of streptozotocin[J]. Biosci Biotechnol Biochem, 2000, 64(6):1153-1158. DOI: 10.1271/bbb.64.1153.
[12] Neckell A. Adaptometry in diabetic patients[J]. Oftalmologia, 2007, 51(3):95-97.
[13] Villarroel M, Ciudin A, Hernández C, et al. Neurodegeneration: an early event of diabetic retinopathy[J]. World J Diabetes, 2010, 1(2):57-64. DOI: 10.4239/wjd.v1.i2.57.
[14] Li Q, Zemel E, Miller B, et al. Early retinal damage in experimental diabetes: electroretinographical and morphological observations[J]. Exp Eye Res, 2002, 74(5):615-625. DOI: 10.1006/exer.2002.1170.
[15] Chesler K, Motz C, Vo H, et al. Initiation of L-DOPA treatment after detection of diabetes-induced retinal dysfunction reverses retinopathy and provides neuroprotection in rats[J/OL]. Transl Vis Sci Technol, 2021, 10(4):8[2022-07-30]. http://www.ncbi.nlm.nih.gov/pubmed/34003986. DOI: 10.1167/tvst.10.4.8.
[16] Bahia PK, Pugh V, Hoyland K, et al. Neuroprotective effects of phenolic antioxidant tBHQ associate with inhibition of FoxO3a nuclear translocation and activity[J]. J Neurochem, 2012, 123(1):182-191. DOI: 10.1111/j.1471-4159.2012. 07877.x.
[17] Behl T, Kaur I, Kotwani A. Implication of oxidative stress in progression of diabetic retinopathy[J]. Surv Ophthalmol, 2016, 61(2):187-196. DOI: 10.1016/ j.survophthal.2015.06.001.
[18] Othman R, Vaucher E, Couture R. Bradykinin type 1 receptor – inducible nitric oxide synthase: a new axis implicated in diabetic retinopathy[J/OL]. Front Pharmacol, 2019, 10:300[2021-09-12]. http://www.ncbi.nlm.nih.gov/pubmed/30983997. DOI: 10.3389/fphar.2019.00300.
[19] Luo S, Lei H, Qin H, et al. Molecular mechanisms of endothelial NO synthase uncoupling[J]. Curr Pharm Des, 2014, 20(22):3548-3553. DOI: 10.2174/ 13816128113196660746.
[20] Chen Y, Jiang B, Zhuang Y, et al. Differential effects of heat shock protein 90 and serine 1179 phosphorylation on endothelial nitric oxide synthase activity and on its cofactors[J/OL]. PLoS One, 2017, 12(6):e0179978[2021-10-16]. http://www. ncbi.nlm.nih.gov/pubmed/28654706. DOI: 10.1371/journal.pone. 0179978.
[21] Yang HH, Chen Y, Gao CY, et al. Protective effects of microRNA-126 on human cardiac microvascular endothelial cells against hypoxia/reoxygenation-induced injury and inflammatory response by activating PI3K/Akt/eNOS signaling pathway[J]. Cell Physiol Biochem, 2017, 42(2):506-518. DOI: 10.1159/000477597.
[22] Graupera M, Potente M. Regulation of angiogenesis by PI3K signaling networks[J]. Exp Cell Res, 2013, 319(9):1348-1355. DOI: 10.1016/j.yexcr.2013.02. 021.
[23] Wei Y, Zhou J, Yu H, et al. AKT phosphorylation sites of Ser473 and Thr308 regulate AKT degradation[J]. Biosci Biotechnol Biochem, 2019, 83(3):429-435. DOI: 10.1080/09168451.2018.1549974.
[24] Yang X, Huo F, Liu B, et al. Crocin inhibits oxidative stress and pro-inflammatory response of microglial cells associated with diabetic retinopathy through the activation of PI3K/Akt signaling pathway[J]. J Mol Neurosci, 2017, 61(4): 581-589. DOI: 10.1007/s12031-017-0899-8.