Authors: Shen Shuhong, Li Yan, Ma Jia, Chen Qianbo, Xi Xiaoting
Corresponding author: Xi Xiaoting, Email:xi_xiao_ting@163.com
Published:2026-09-10
DOI:10.3760/cma.j.cn115989-20260330-00144
ABSTRACT
Objective To investigate the regulatory effect and molecular mechanism of acteoside on oxidative stress and mitochondrial damage in high glucose-induced human retinal pigment epithelial cells (ARPE-19).
Methods ARPE-19 cells were divided into normal control group, mannitol group, high-glucose group, high-glucose+Mito-TEMPO (reactive oxygen species [ROS] scavenger) group, high-glucose+acteoside group, high-glucose+acteoside+BafA1 (autophagy inhibitor) group, high-glucose+acteoside+EX-527 (sirtuin 1 [SIRT1] inhibitor) group, and high- glucose+acteoside+si-SIRT1 transfection group. After corresponding treatments according to grouping, the cell viability of different groups was detected using cell counting kit-8; adenosine triphosphate (ATP) content was measured with an ATP level assay kit; mitochondrial membrane potential was detected via JC-1 staining; mitochondrial ROS level was determined by MitoSOX Red staining; autophagic flux was assessed using mRFP-GFP-LC3 dual fluorescence labeling; the relative expression levels of SIRT1, PINK1, Parkin, LC3Ⅱ/Ⅰ and p62 proteins were examined by Western blot.
Results The cell viability, ATP content and mitochondrial membrane potential were significantly lower and the mitochondrial ROS level was significantly higher in the high-glucose group than those in the normal control group, mannitol group and high-glucose+acteoside group (all P<0.05). The cell viability, ATP content and mitochondrial membrane potential were higher and the mitochondrial ROS level was lower in the high-glucose+acteoside group than those in the high-glucose+acteoside+EX-527 group and high-glucose+acteoside+si-SIRT1 transfection group and all differences were statistically significant (all P<0.05). The cell viability and ATP content were significantly lower in the high-glucose group than in the high-glucose+Mito-TEMPO group (both P<0.05). The relative expression levels of PINK1 and Parkin proteins in the high-glucose group were significantly lower than those in the normal control group, mannitol group and high-glucose+acteoside group, whereas the relative expression levels of LC3 Ⅱ/Ⅰ and p62 proteins in the high-glucose group were significantly higher than those in the normal control group and mannitol group (all P<0.05). The relative expression levels of LC3Ⅱ/Ⅰ and p62 proteins were higher in the high-glucose group than in the normal control group (both P<0.05). The relative expression level of LC3Ⅱ/Ⅰ protein in the high-glucose+acteoside group was higher than that in the high-glucose group but lower than that in the high-glucose+acteoside+BafA1 group (both P<0.05). The relative expression level of p62 protein in the high-glucose+acteoside group was lower than that in the high-glucose group and high-glucose+acteoside+BafA1 group (both P<0.05). The relative expression levels of SIRT1, PINK1, Parkin and LC3Ⅱ/Ⅰ proteins were higher and the relative expression level of p62 protein was lower in the high-glucose+acteoside group than in the high-glucose+acteoside+EX-527 group and high-glucose+acteoside+si-SIRT1 transfection group (all P<0.05). The GFP/mRFP fluorescence intensities of the normal control group, high-glucose group, high-glucose+acteoside group and high-glucose+acteoside+BafA1 group were 0.22±0.10, 0.72±0.04, 0.43±0.06 and 0.61±0.04, respectively, with a statistically significant overall difference ( F=33.68, P<0.001). The GFP/mRFP fluorescence intensity was higher in the high-glucose group than in the normal control group and high-glucose+acteoside group, and higher in the high-glucose+acteoside+BafA1 group than in the high-glucose+acteoside group, with statistically significant differences (all P<0.05).
Conclusions Acteoside alleviates high glucose-induced oxidative stress and mitochondrial damage in ARPE-19 cells by activating SIRT1 to promote PINK1/Parkin-mediated mitophagy.
KEYWORDS:
Diabetic retinopathy;Acteoside;Mitophagy;PINK1/Parkin;SIRT1
COPYRIGHTS:
Copyright by Chinese Medical Association
No content published by the journals of Chinese Medical Association may be reproduced or abridged without authorization. Please do not use or copy the layout and design of the journals without permission.
All articles published represent the opinions of the authors, and do not reflect the official policy of the Chinese Medical Association or the Editorial Board, unless this is clearly specified.
Authors Info & Affiliations
Shen Shuhong
Department of Ophthalmology, The First Affiliated Hospital of Kunming Medical University, Kunming 650032, China
Li Yan
Department of Ophthalmology, The First Affiliated Hospital of Kunming Medical University, Kunming 650032, China
Ma Jia
Department of Ophthalmology, The First Affiliated Hospital of Kunming Medical University, Kunming 650032, China
Chen Qianbo
Department of Ophthalmology, The First Affiliated Hospital of Kunming Medical University, Kunming 650032, China
Xi Xiaoting
Department of Ophthalmology, The First Affiliated Hospital of Kunming Medical University, Kunming 650032, China
Figures & Tables
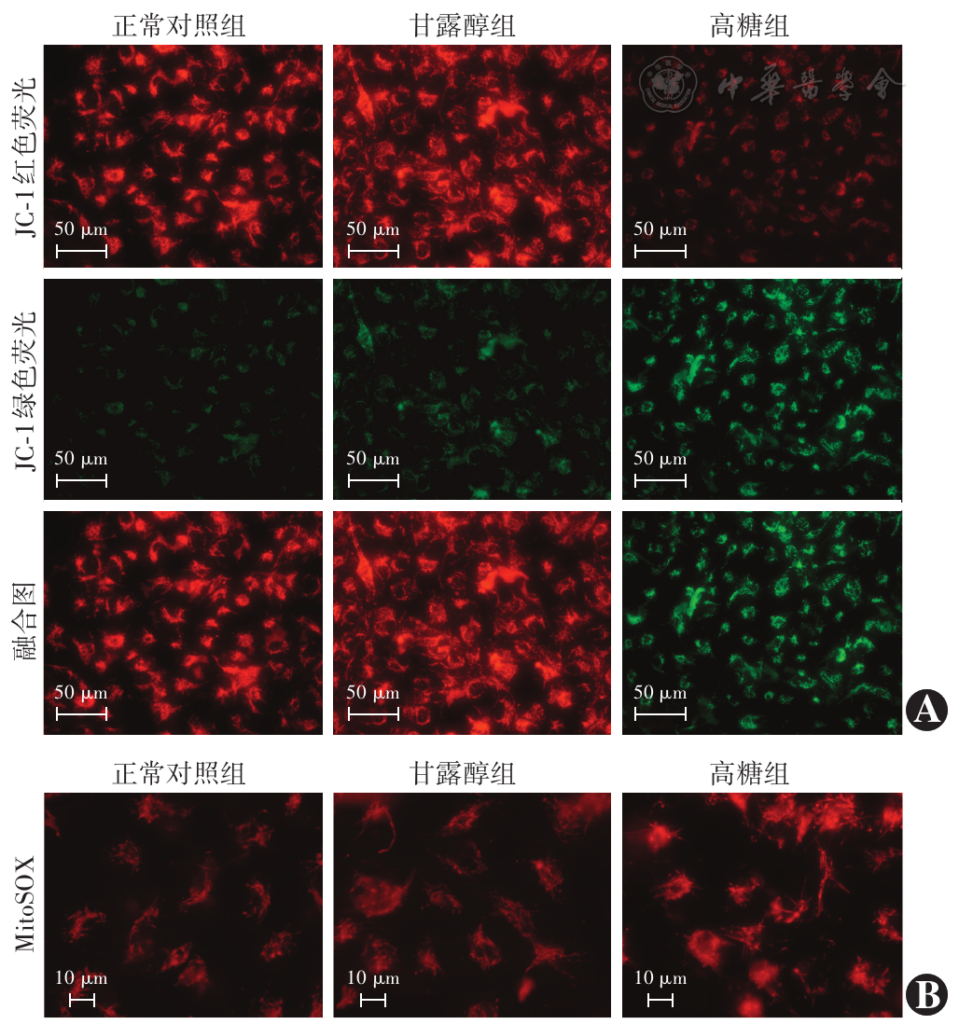
Figure 1 JC-1 and MitoSOX staining images of each group A: JC-1 staining image (×400, scale bar=50 μm) B: MitoSOX staining image (×1 000, scale bar=10 μm)
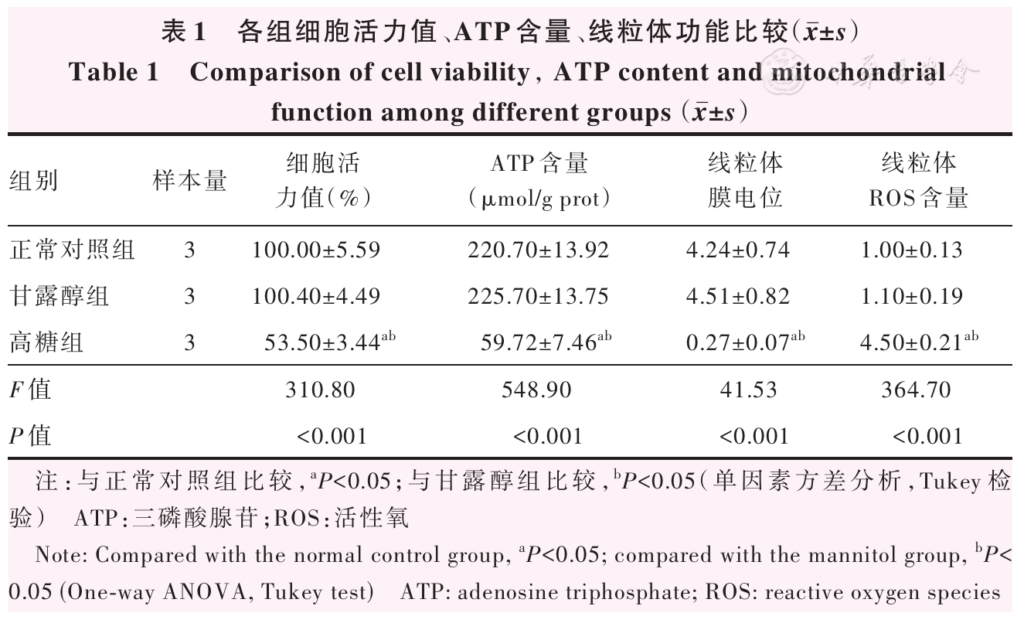
Table 1 Comparison of cell viability,ATP content and mitochondrial function among different groups (mean±SD) Note: Compared with the normal control group, aP<0.05; compared with the mannitol group, bP<0.05 (One-way ANOVA, Tukey test) ATP: adenosine triphosphate; ROS: reactive oxygen species
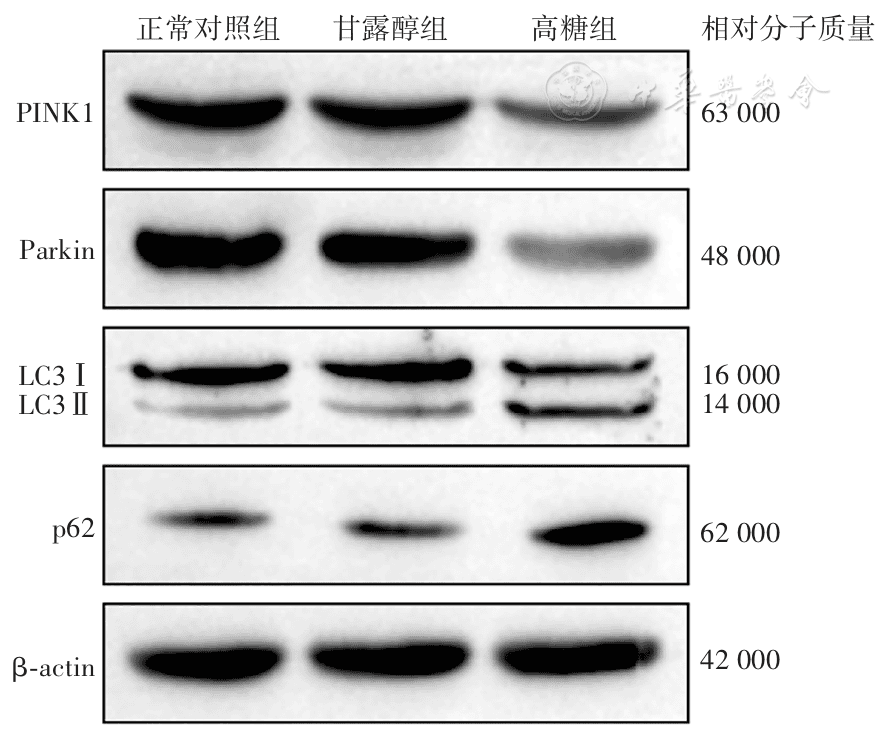
Figure 2 Electrophoretogram of autophagy-related protein expression in each group
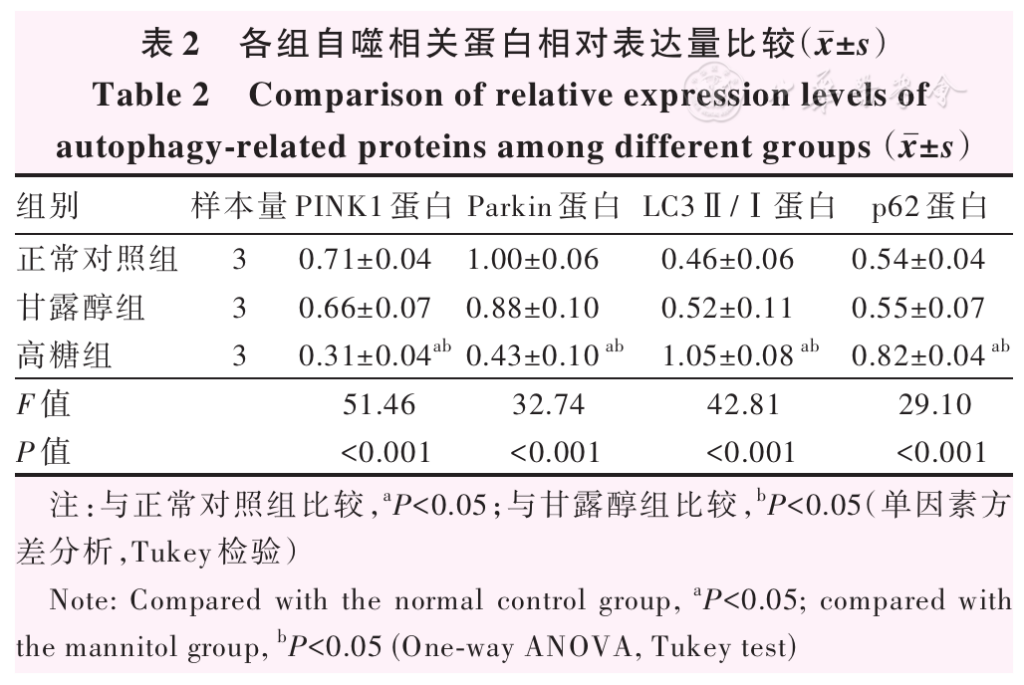
Table 2 Comparison of relative expression levels of autophagy-related proteins among different groups (mean±SD) Note: Compared with the normal control group, aP<0.05; compared with the mannitol group, bP<0.05 (One-way ANOVA, Tukey test)
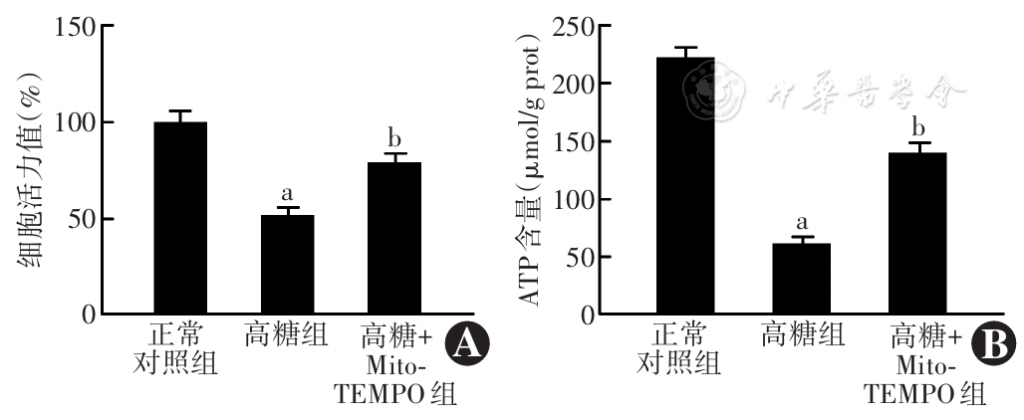
Figure 3 Comparison of cell viability and ATP content among different groups after inhibiting mitochondrial ROS A: Comparison of cell viability F=238.60, P<0.001. Compared with the normal control group, aP<0.001; compared with the high-glucose group, bP<0.001 (One-way ANOVA, Tukey test; n=3) B: Comparison of ATP content F=890.20, P<0.001. Compared with the normal control group, aP<0.001; compared with the high-glucose group, bP<0.001 (One-way ANOVA, Tukey test; n=3) ROS: reactive oxygen species; ATP: adenosine triphosphate
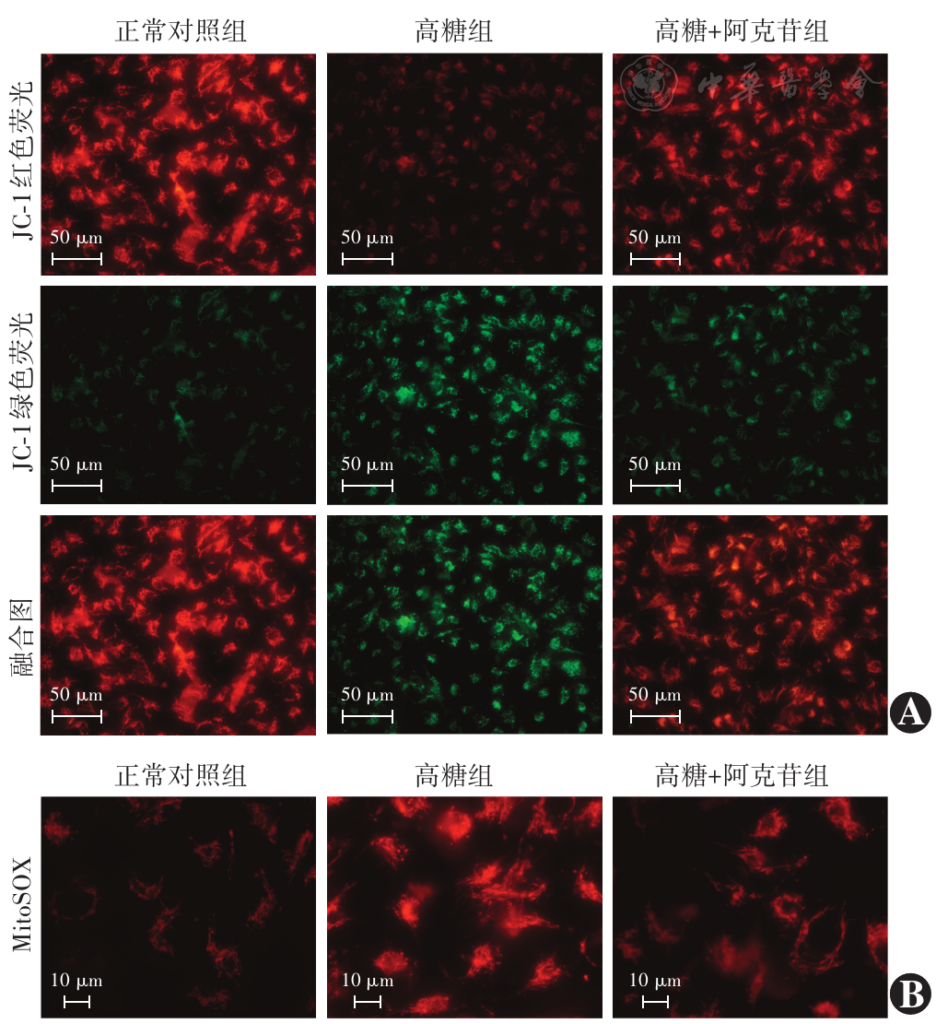
Figure 4 JC-1 and MitoSOX staining images of each group after acteoside treatment A: JC-1 staining image (×400, scale bar=50 μm) B: MitoSOX staining image (×1 000, scale bar=10 μm)
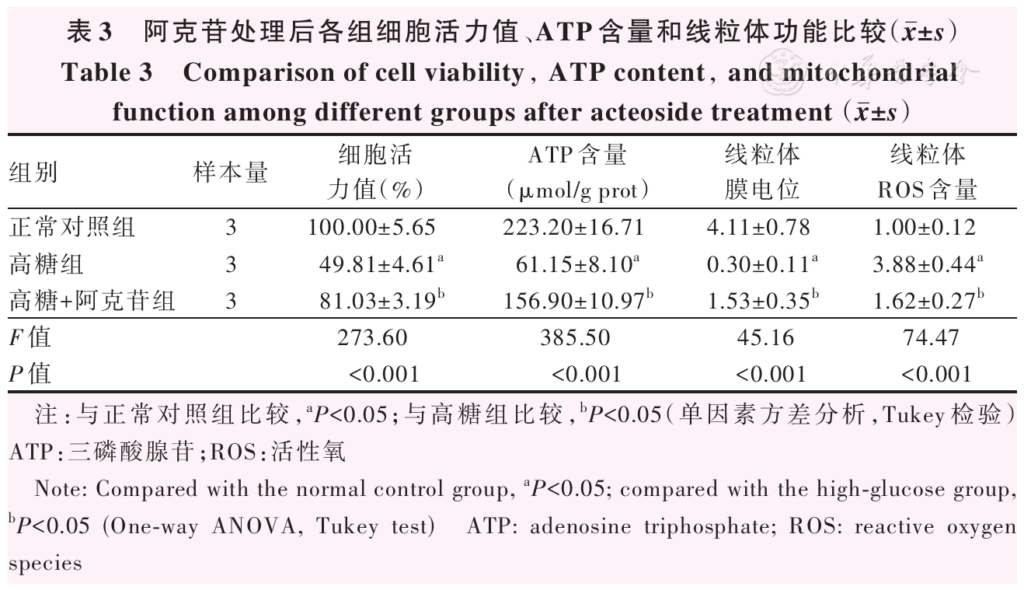
Table 3 Comparison of cell viability,ATP content,and mitochondrial function among different groups after acteoside treatment (mean±SD) Note: Compared with the normal control group, a P<0.05; compared with the high-glucose group, b P<0.05 (One-way ANOVA, Tukey test) ATP: adenosine triphosphate; ROS: reactive oxygen species
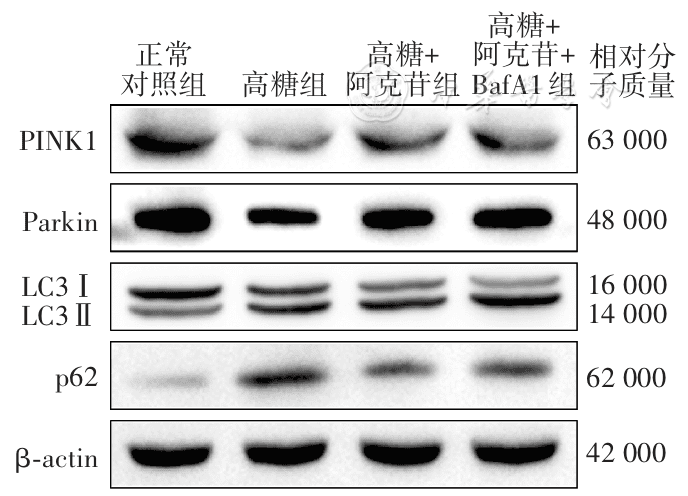
Figure 5 Electrophoretogram of autophagy-related protein expression in each group after treatment with autophagy inhibitors
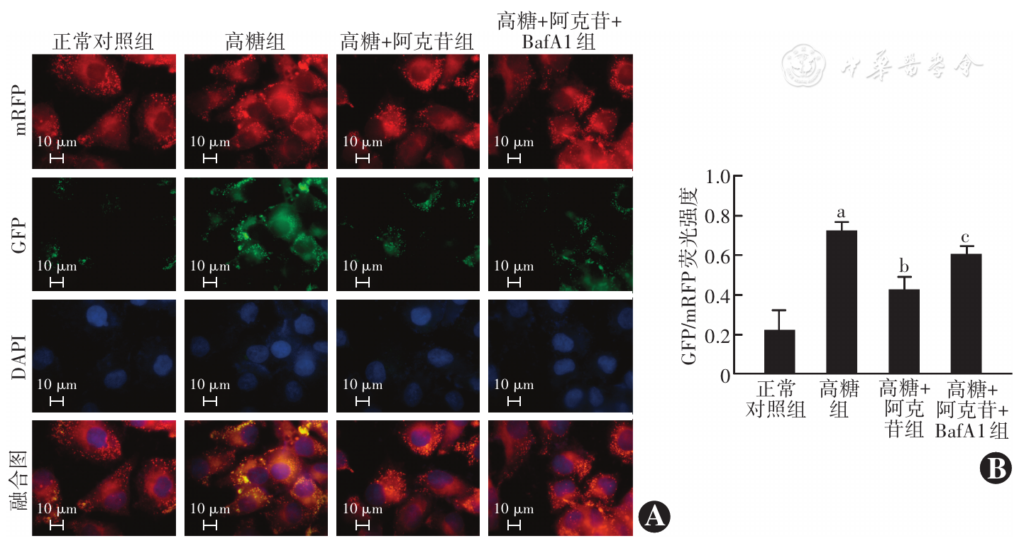
Figure 6 Comparison of autophagy flux among different groups after treatment with autophagy inhibitors A: mRFP-GFP-LC3 dual fluorescence staining images of each group (mRFP-GFP ×1 000, scale bar=10 μm) B: Comparison of GFP/mRFP fluorescence intensity among different groups F=33.68, P<0.001. Compared with the normal control group, aP<0.05; compared with the high-glucose group, bP<0.05; compared with the high-glucose+acteoside group, cP<0.05 (One-way ANOVA, Tukey test; n=3)
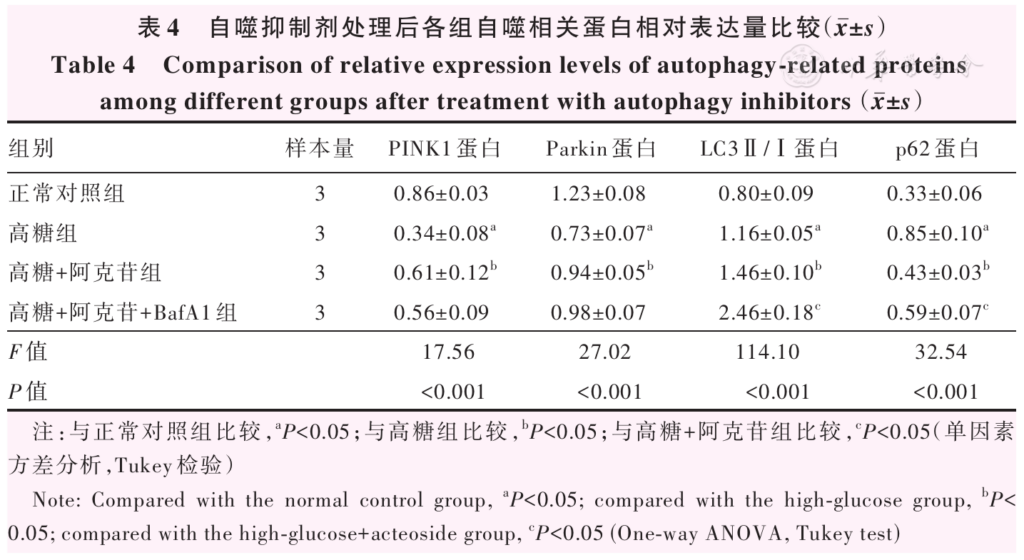
Table 4 Comparison of relative expression levels of autophagy-related proteins among different groups after treatment with autophagy inhibitors (mean±SD) Note: Compared with the normal control group, aP<0.05; compared with the high-glucose group, bP<0.05; compared with the high-glucose+acteoside group, cP<0.05 (One-way ANOVA, Tukey test)
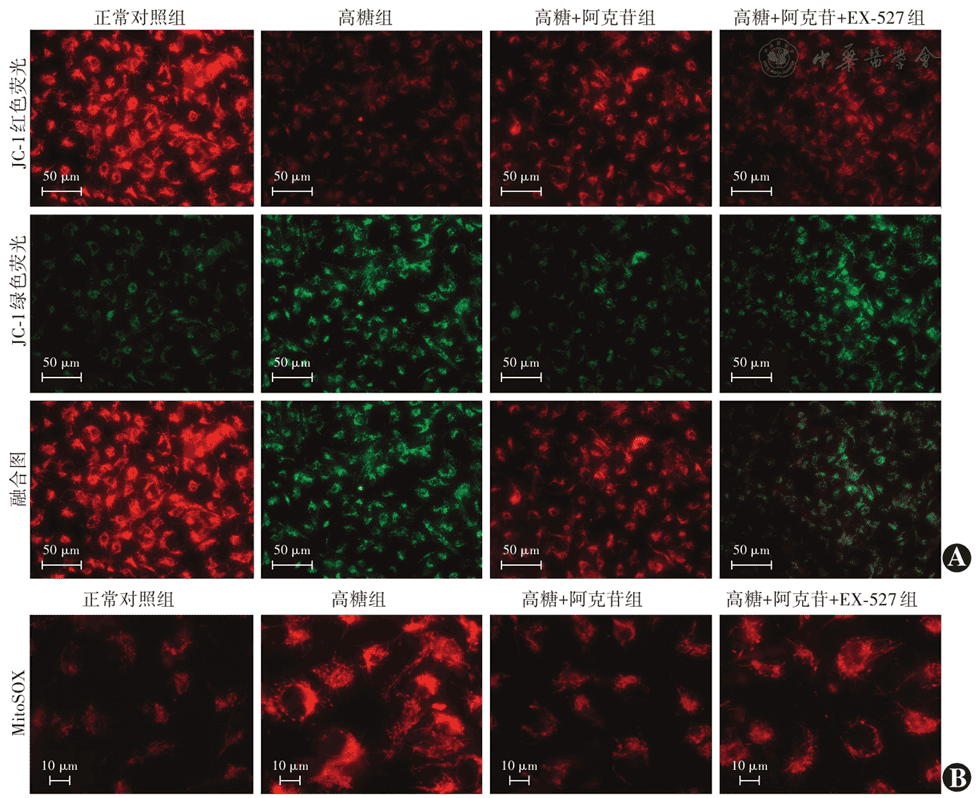
Figure 7 JC-1 and MitoSOX staining images of different groups after SIRT1 inhibitor treatment A: JC-1 staining image (×400, scale bar=50 μm) B: MitoSOX staining image (×1 000, scale bar=10 μm) SIRT1: sirtuin 1
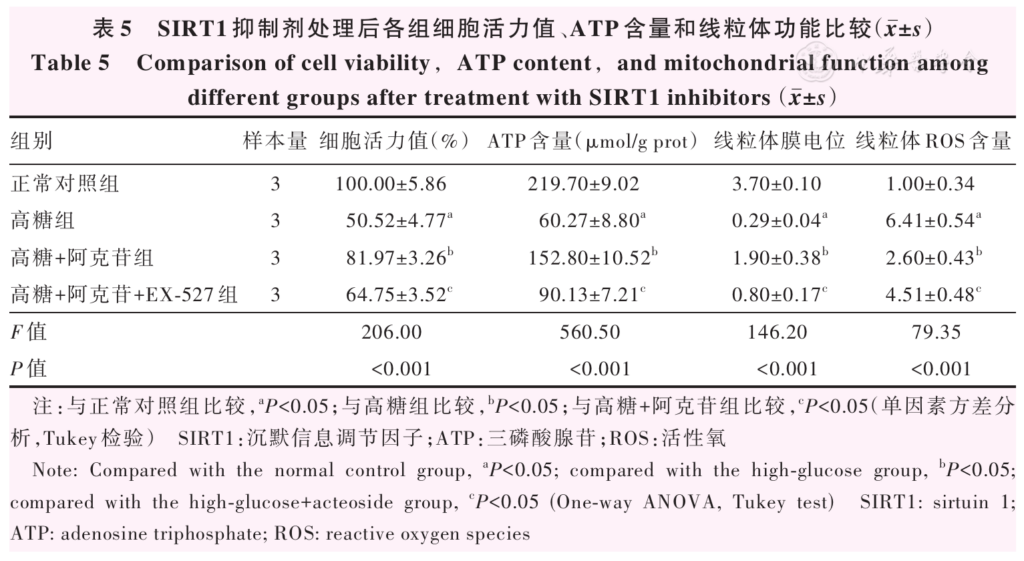
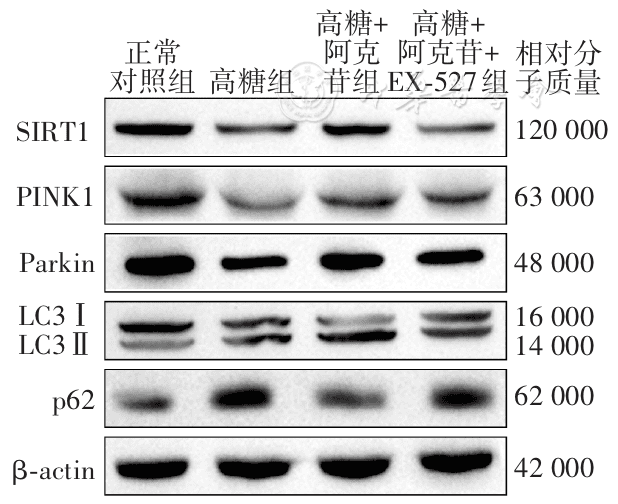
Figure 8 Electrophoretogram of SIRT1 protein and autophagy-related protein expression in each group after SIRT1 inhibitor treatment SIRT1: sirtuin 1
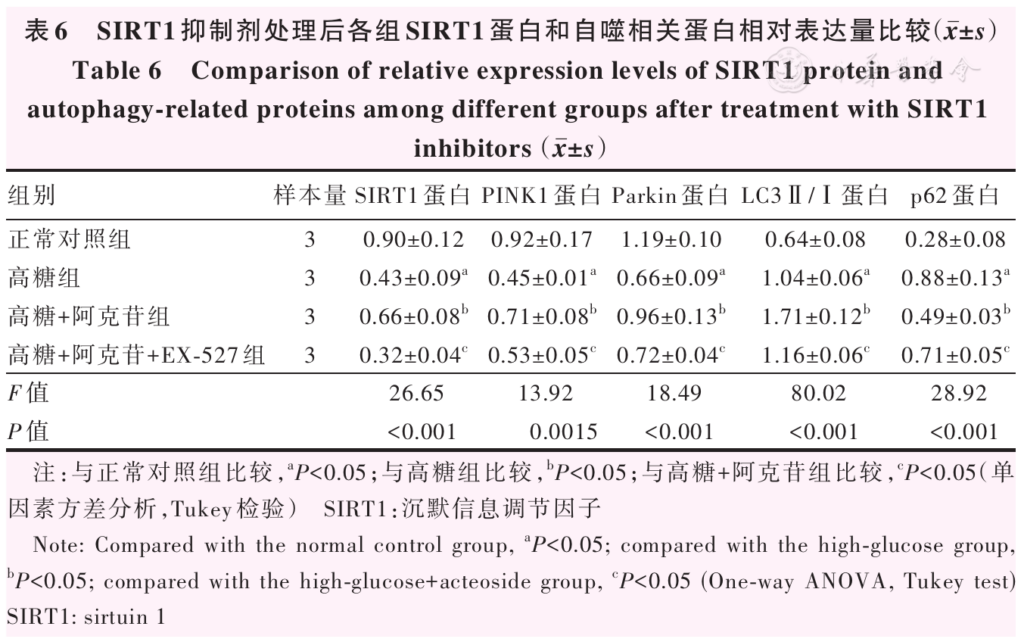
Table 6 Comparison of relative expression levels of SIRT1 protein and autophagy-related proteins among different groups after treatment with SIRT1 inhibitors (mean±SD) Note: Compared with the normal control group, aP<0.05; compared with the high-glucose group, bP<0.05; compared with the high-glucose+acteoside group, cP<0.05 (One-way ANOVA, Tukey test) SIRT1: sirtuin 1
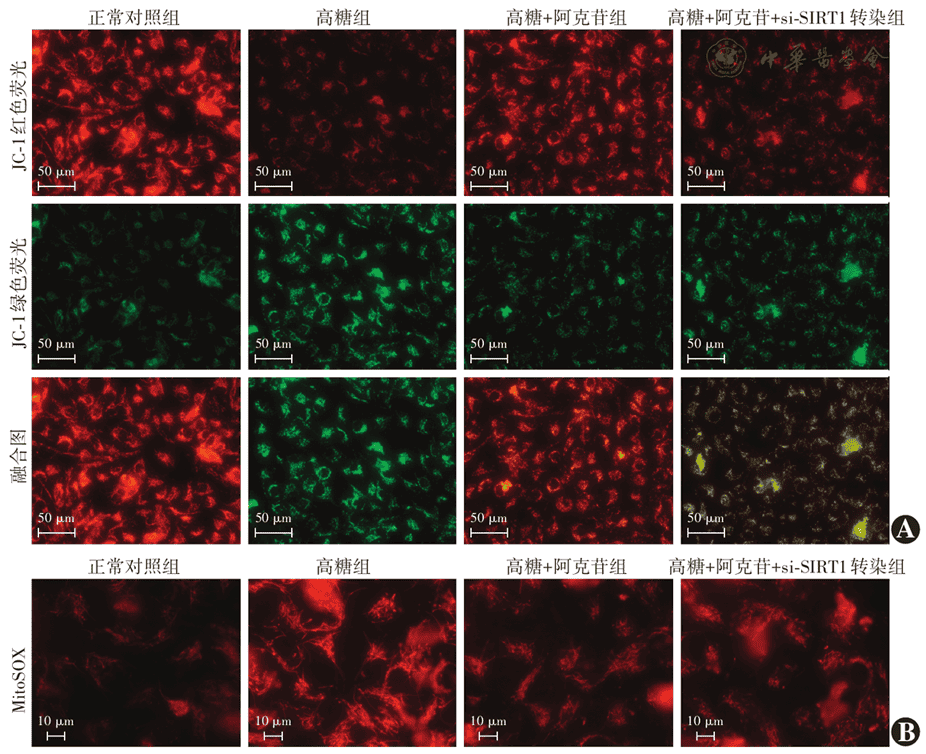
Figure 9 JC-1 and MitoSOX staining images of different groups after si-SIRT1 transfection A: JC-1 staining image (×400, scale bar=50 μm) B: MitoSOX staining image (×1 000, scale bar=10 μm) SIRT1: sirtuin 1
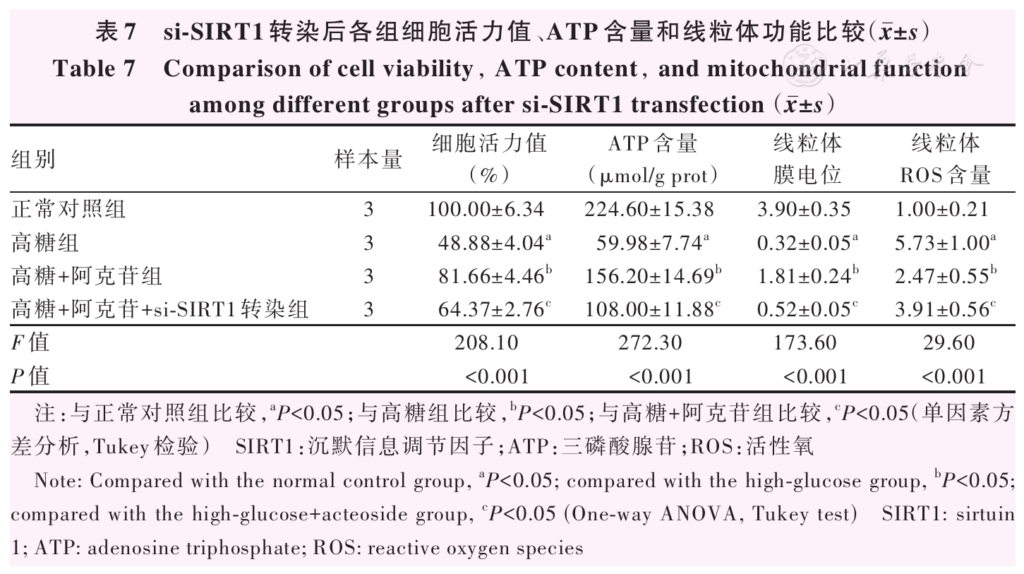
Table 7 Comparison of cell viability,ATP content,and mitochondrial function among different groups after si-SIRT1 transfection (mean±SD) Note: Compared with the normal control group, aP<0.05; compared with the high-glucose group, bP<0.05; compared with the high-glucose+acteoside group, cP<0.05 (One-way ANOVA, Tukey test) SIRT1: sirtuin 1; ATP: adenosine triphosphate; ROS: reactive oxygen species
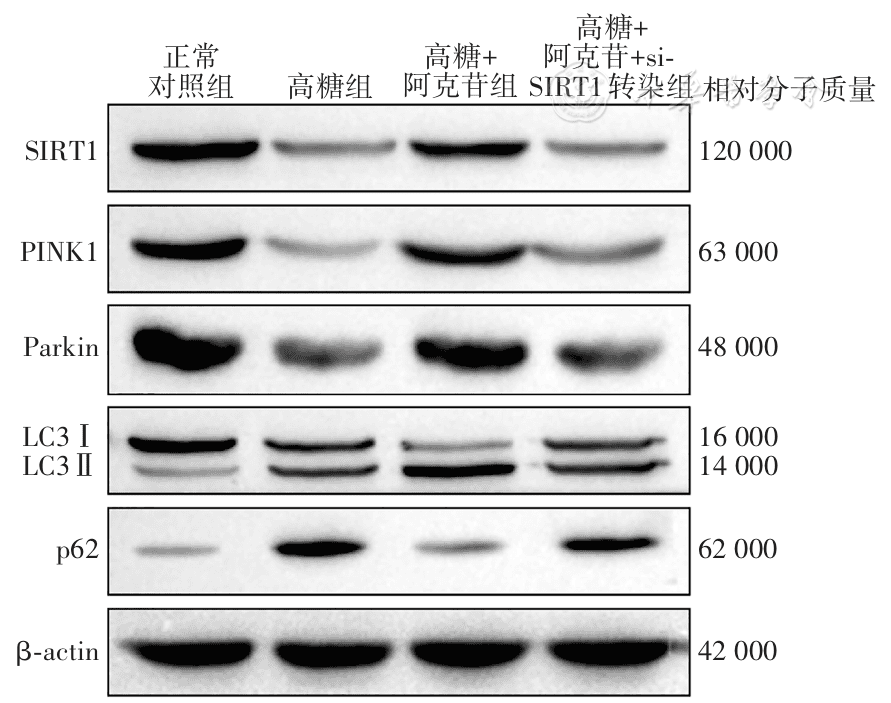
Figure 10 Electrophoretogram of SIRT1 protein and autophagy-related protein expression in each group after si-SIRT1 transfection SIRT1: sirtuin 1
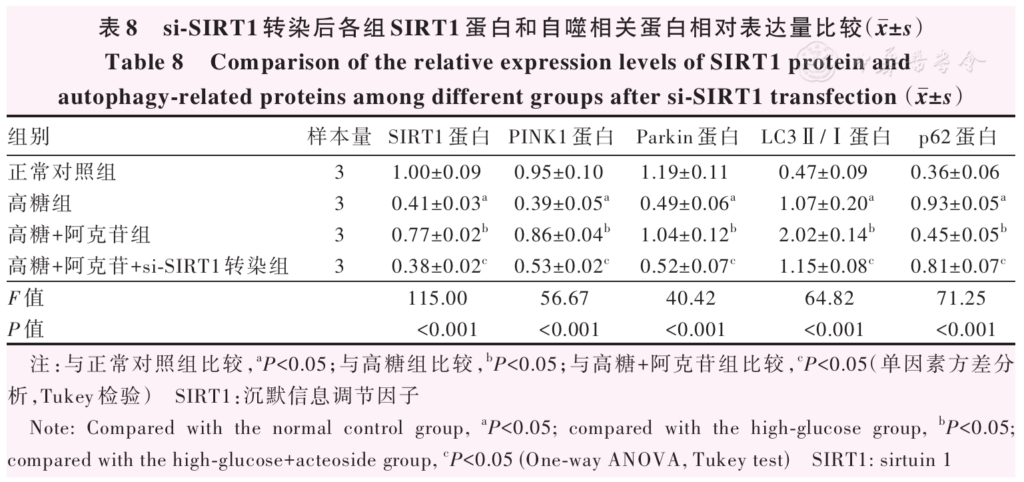
Table 8 Comparison of the relative expression levels of SIRT1 protein and autophagy-related proteins among different groups after si-SIRT1 transfection (mean±SD) Note: Compared with the normal control group, aP<0.05; compared with the high-glucose group, bP<0.05; compared with the high-glucose+acteoside group, cP<0.05 (One-way ANOVA, Tukey test) SIRT1: sirtuin 1
References click to collapse
[1] Chen Y, Tang S, Huang Y, et al. Global burden of blindness or visually impairment attributable to diabetic retinopathy in the adults aged 70 years and older, 1990—2021: results from the global burden of disease study in 2021[J]. Diabetes Res Clin Pract, 2025, 226:112383. DOI: 10.1016/j.diabres.2025.112383.
[2] Tarasewicz D, Conell C, Gilliam LK, et al. Quantification of risk factors for diabetic retinopathy progression[J]. Acta Diabetol, 2023, 60(3): 363-369. DOI: 10.1007/s00592-022-02007-6.
[3] Bhatwadekar AD, Shughoury A, Belamkar A, et al. Genetics of diabetic retinopathy, a leading cause of irreversible blindness in the industrialized world[J]. Genes (Basel), 2021, 12(8):1200. DOI: 10.3390/genes12081200.
[4] Sadikan MZ, Abdul Nasir NA. Diabetic retinopathy: emerging concepts of current and potential therapy[J]. Naunyn Schmiedebergs Arch Pharmacol, 2023, 396(12):3395-3406. DOI: 10.1007/s00210-023-02599-y.
[5] Kowluru RA. Diabetic retinopathy: mitochondrial dysfunction and retinal capillary cell death[J]. Antioxid Redox Signal, 2005, 7(11-12): 1581-1587. DOI: 10.1089/ars.2005.7.1581.
[6] Bek T. Mitochondrial dysfunction and diabetic retinopathy[J]. Mitochondrion, 2017, 36:4-6. DOI: 10.1016/j.mito.2016.07.011.
[7] Xi X, Ma J, Chen Q, et al. Acteoside attenuates hydrogen peroxide-induced injury of retinal ganglion cells via the CASC2/ miR-155/mTOR axis[J]. Ann Transl Med, 2022, 10(1):5. DOI: 10.21037/atm-21-5630.
[8] Zhang FK, Jia KX, Wang H, et al. Acteoside as a rising star for clinical treatment: current fundamental research and future outlooks[J]. J Integr Med, 2026, 24(1):7-23. DOI: 10.1016/j.joim.2025.08.007.
[9] Yang J, Hua Z, Zheng Z, et al. Acteoside inhibits high glucose-induced oxidative stress injury in RPE cells and the outer retina through the Keap1/Nrf2/ARE pathway[J]. Exp Eye Res, 2023, 232:109496. DOI: 10.1016/j.exer.2023.109496.
[10] Han Z, Wang B, Wen YQ, et al. Acteoside alleviates lipid peroxidation by enhancing Nrf2-mediated mitophagy to inhibit ferroptosis for neuroprotection in Parkinson’s disease[J]. Free Radic Biol Med, 2024, 223:493-505. DOI: 10.1016/j.freeradbiomed.2024.07.018.
[11] Narendra DP, Youle RJ. The role of PINK1-Parkin in mitochondrial quality control[J]. Nat Cell Biol, 2024, 26(10):1639-1651. DOI: 10.1038/s41556-024-01513-9.
[12] Zhang Y, Xi X, Mei Y, et al. High-glucose induces retinal pigment epithelium mitochondrial pathways of apoptosis and inhibits mitophagy by regulating ROS/PINK1/Parkin signal pathway[J]. Biomed Pharmacother, 2019, 111:1315-1325. DOI: 10.1016/j.biopha.2019.01.034.
[13] Cong M, Qi X, Sun H, et al. Acteoside ameliorates hepatic steatosis and liver injury in MASLD mice through activation of PINK1/Parkin-related mitophagy markers[J]. Nutrients, 2025, 18(1):118. DOI: 10.3390/nu18010118.
[14] Wei X, Xiong X, Wang P, et al. SIRT1-mediated deacetylation of FOXO3 enhances mitophagy and drives hormone resistance in endometrial cancer[J]. Mol Med, 2024, 30(1):147. DOI: 10.1186/s10020-024-00915-7.
[15] Sukboon P, Phumsuay R, Promkum C, et al. Mulberry extract mitigates glucose-induced oxidative injury in differentiated ARPE-19 cells by enhancing antioxidant defense: implications for diabetic retinopathy[J/OL]. Food Sci Nutr, 2025, 13(5):e70180[2026-03-18]. http://www.ncbi.nlm.nih.gov/pubmed/40330202. DOI: 10.1002/fsn3.70180.
[16] Park C, Cha HJ, Kim MY, et al. Phloroglucinol attenuates DNA damage and apoptosis induced by oxidative stress in human retinal pigment epithelium ARPE-19 cells by blocking the production of mitochondrial ROS[J]. Antioxidants (Basel), 2022, 11(12):2353. DOI: 10.3390/antiox11122353.
[17] Sun Y, Zheng Y, Wang C, et al. Glutathione depletion induces ferroptosis, autophagy, and premature cell senescence in retinal pigment epithelial cells[J]. Cell Death Dis, 2018, 9(7):753. DOI: 10.1038/s41419-018-0794-4.
[18] Chen W, Lin B, Xie S, et al. Naringenin protects RPE cells from NaIO3-induced oxidative damage in vivo and in vitro through up-regulation of SIRT1[J]. Phytomedicine, 2021, 80:153375. DOI: 10.1016/j.phymed.2020.153375.
[19] Li H, Liu X, Zhong H, et al. Research progress on the pathogenesis of diabetic retinopathy[J]. BMC Ophthalmol, 2023, 23(1):372. DOI: 10.1186/s12886-023-03118-6.
[20] Wu Y, Zou H. Research progress on mitochondrial dysfunction in diabetic retinopathy[J]. Antioxidants (Basel), 2022, 11(11):2250. DOI: 10.3390/antiox11112250.
[21] Lam CH, Zou B, Chan HH, et al. Functional and structural changes in the neuroretina are accompanied by mitochondrial dysfunction in a type 2 diabetic mouse model[J]. Eye Vis (Lond), 2023, 10(1):37. DOI: 10.1186/s40662-023-00353-2.
[22] Li Y, Xu W, Zhao G, et al. TRAP1 improves diabetic retinopathy by preserving mitochondrial function[J]. Clin Ophthalmol, 2025, 19: 2343-2362. DOI: 10.2147/OPTH.S521660.
[23] Chen Q, Xi X, Zeng Y, et al. Acteoside inhibits autophagic apoptosis of retinal ganglion cells to rescue glaucoma-induced optic atrophy[J]. J Cell Biochem, 2019, 120(8):13133-13140. DOI: 10.1002/jcb.28586.
[24] Xi X, Chen Q, Ma J, et al. Acteoside protects retinal ganglion cells from experimental glaucoma by activating the PI3K/AKT signaling pathway via caveolin 1 upregulation[J]. Ann Transl Med, 2022, 10(6):312. DOI: 10.21037/atm-22-136.
[25] Xi X, Liu X, Chen Q, et al. Acteoside relieves diabetic retinopathy through the inhibition of Müller cell reactive hyperplasia by regulating TXNIP and mediating Kir4.1 channels in a PI3K/Akt-dependent manner[J/OL]. PLoS One, 2024, 19(12):e0312565[2026-03-22]. http://www.ncbi.nlm.nih.gov/pubmed/39689088. DOI: 10.1371/journal.pone.0312565.
[26] Huang L, Yao T, Chen J, et al. Effect of Sirt3 on retinal pigment epithelial cells in high glucose through Foxo3a/ PINK1-Parkin pathway mediated mitophagy[J]. Exp Eye Res, 2022, 218:109015. DOI: 10.1016/j.exer.2022.109015.
[27] D’Amico AG, Maugeri G, Magrì B, et al. Targeting the PINK1/Parkin pathway: a new perspective in the prevention and therapy of diabetic retinopathy[J]. Exp Eye Res, 2024, 247:110024. DOI: 10.1016/j.exer.2024.110024.
[28] Zhang S, Gong F, Liu J, et al. A novel PHD2 inhibitor acteoside from Cistanche tubulosa induces skeletal muscle mitophagy to improve cancer-related fatigue[J]. Biomed Pharmacother, 2022, 150:113004. DOI: 10.1016/j.biopha.2022.113004.
[29] Yang Y, Liu Y, Wang Y, et al. Regulation of SIRT1 and its roles in inflammation[J]. Front Immunol, 2022, 13:831168. DOI: 10.3389/fimmu.2022.831168.
[30] Mishra M, Duraisamy AJ, Kowluru RA. Sirt1: a guardian of the development of diabetic retinopathy[J]. Diabetes, 2018, 67(4):745-754.DOI: 10.2337/db17-0996.
[31] Li L, Chen J, Zhou Y, et al. Artesunate alleviates diabetic retinopathy by activating autophagy via the regulation of AMPK/SIRT1 pathway[J]. Arch Physiol Biochem, 2023, 129(4): 943-950. DOI: 10.1080/13813455.2021.1887266.
[32] Guan S, Xin Y, Ding Y, et al. Ginsenoside Rg1 protects against cardiac remodeling in heart failure via SIRT1/PINK1/Parkin-mediated mitophagy[J/OL]. Chem Biodivers, 2023, 20(2):e202200730[2026-03-26]. http://www.ncbi.nlm.nih.gov/pubmed/36639922. DOI: 10.1002/cbdv.202200730.
[33] Corbi G, Conti V, Komici K, et al. Phenolic plant extracts induce sirt1 activity and increase antioxidant levels in the rabbit’s heart and liver[J]. Oxid Med Cell Longev, 2018, 2018:2731289. DOI: 10.1155/2018/2731289.