·Experimental Research·
Potential target genes detected by bioinformatics in dexamethasone-induced open-angle glaucoma
Liu Liling, Li Deling, Zeng Weiting, Zhang Xinyi, Xu Jiangang, Yu Minbin
State Key Laboratory of Ophthalmology, Zhongshan Ophthalmic Certer, Sun Yat-sen University, Guangdong Provincial Key Laboratory of Ophthalmology and Visual Science, Guangzhou 510060, China
Corresponding author: Yu Minbin, Email: yuminbin@mail.sysu.edu.cn
Abstract [Download PDF in English] [Download PDF in Chinese] [Read Full Text]
Objective To predict potential target genes in dexamethasone-induced open-angle glaucoma using bioinformatic technology.
Methods The Gene Expression Omnibus(GEO) databases GSE16643, GSE37474 and GSE124114 were used to analyze differentially expressed genes (DEGs) by GEO2R. Gene set enrichment analysis (GSEA) was performed on the DEGs between GSE37474 and GSE124114. Intersection of the three databases was displayed by Venn diagrams. The annotation and enrichment analysis of the intersection genes were compared with normal tissue in the Genotype-Tissue Expression (GTEx) portal database. The corresponding protein intersection network was obtained by search tool for the retrieval of interacting genes and proteins (STRING) analysis and the candidate genes were searched for their transcription factors in University of California Santa Cruz (UCSC) and JASPAR databases. Primary human trabecular meshwork cells were divided into dexamethasone and control groups, treated with 2 ml 500 nmol/L dexamethasone and an equal volume of ethanol, respectively. The expression of BDKRB1 and TAGLN in trabecular cells was detected by western blot.
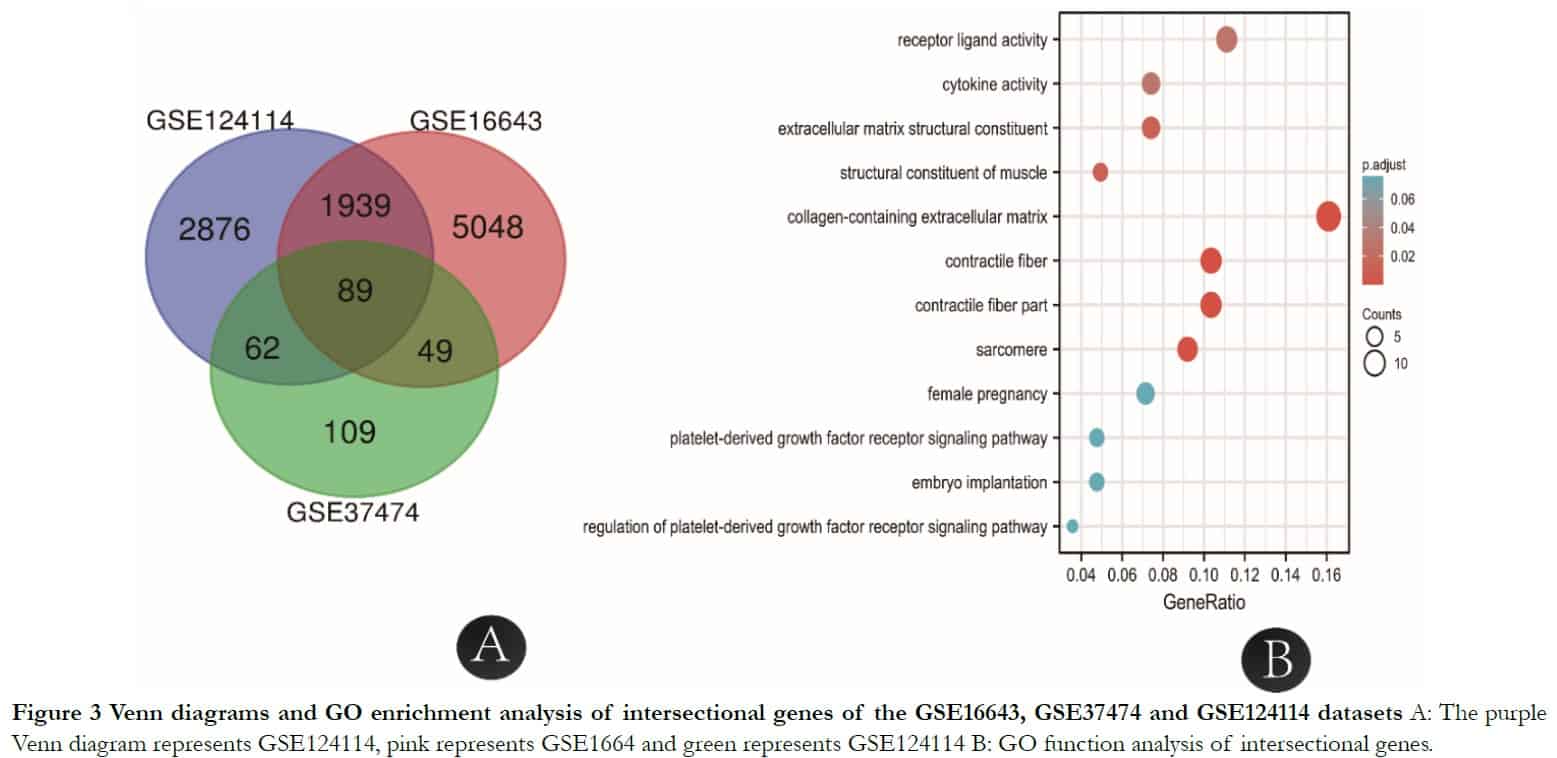
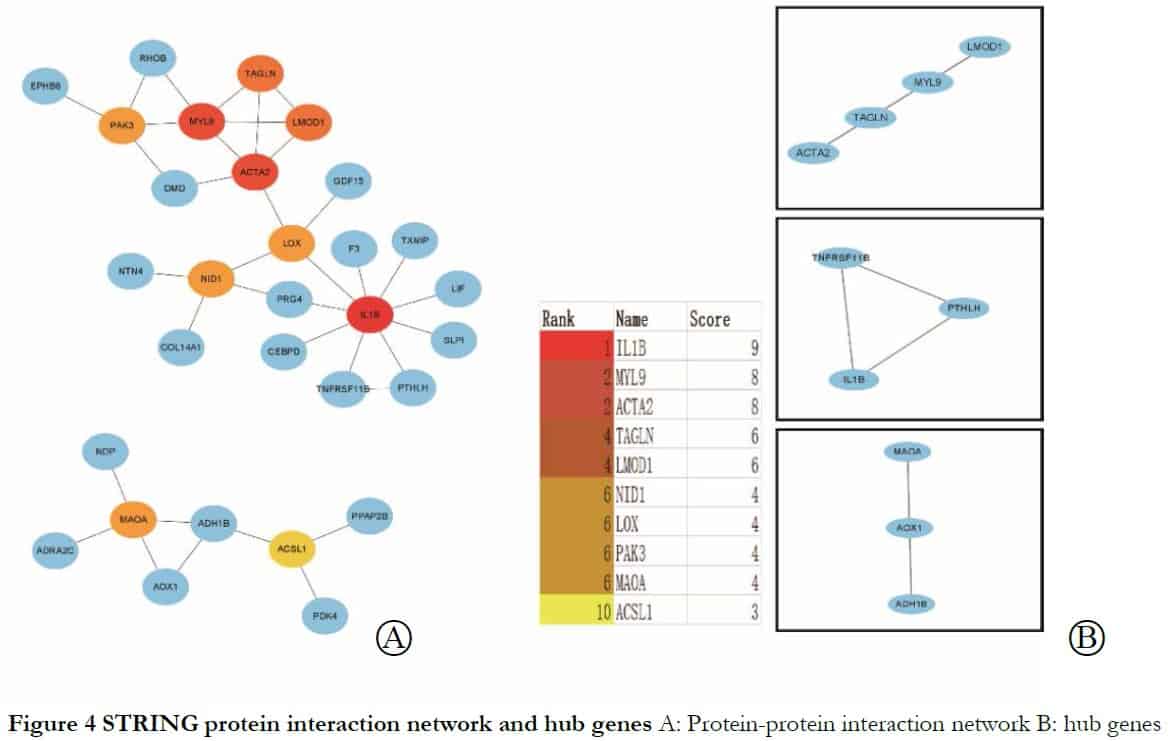
Results Differential genes between GSE37474 and GSE124114 datasets were enriched in complement and coagulation cascades by GSEA. There were 89 intersecting genes in the three datasets, which mainly regulated the formation of extracellular matrix. The gene with the highest enrichment score and collagen-containing extracellular matrix was found to be associated with fibroblasts in the GTEx Portal database and ACTA2, MYL9. TAGLN and LMOD1 were closely related in the STRING protein-protein interaction network. The transcription factor SP1 was detected in UCSC and JASPAR according to related genes: BDKRB1, NID1, MFGE8 and TAGLN. The relative expression levels of BDKRB1 and TAGLN proteins were 1.32±0.14 and 0.44±0.09 in the dexamethasone group, significantly higher than 1.00±0.00 and 0.20±0.10 in the control group, respectively, where t=−3.61 and 2.89 (P<0.05).
Conclusions Bioinformatic analysis showed that the transcription factor SP1 might play a critical role in human trabecular meshwork cells in the transition to myofibroblasts after dexamethasone treatment.
[Key words] Dexamethasone; Glaucoma, open-angle; Trabecular meshwork; Ddifferentially expressed genes; Myofibroblast; Bioinformatics.
DOI: 10.3760/cma.j.cn115989-20211214-00683
Glaucoma is a grouPof eye diseases where damage to the optic nerve and vision loss occurs due to a pathological increase in intraocular pressure. Its pathogenesis involves the interaction of environmental, epigenetic, and genetic factors and if untreated, results in vision loss that is progressive, permanent and inevitable.
Glucocorticoids are used in the treatment of many systemic and ocular diseases, but their long–term use can increase intraocular pressure. They exert their effects by binding to intracellular glucocorticoid receptors (GRs) in the cytoplasm that then translocate into the nucleus. The interaction of glucocorticoids, ligands and receptors can either activate or repress the transcription of target genes, which can involve uPto 10% to 20% of the whole genome1. Studies have found that dexamethasone can decrease extracellular proteolytic enzymes, which result in an accumulation of extracellular matrix in trabecular meshwork (TM) and reorganization of the actin cytoskeleton within the trabecular meshwork2-7. These changes ultimately impede outflow of aqueous humor and elevate IOP.
With the rapid development of genome sequencing technology in an era of data-intensive postgenomic medicine, including genomics, transcriptomics, proteomics, glycomics, lipidomics and metabolomics, large amounts of biological experimental data can be conveniently stored on computers and analyzed. Web search has become an indispensable tool for finding biological databases and bioinformatics and allowing the storage, retrieval and analysis of biological information. The commonly used research methods include differentially expressed genes (DEGs), gene ontology (GO), Kyoto encyclopedia of genes and genomes (KEGG) and Weighted gene co-expression network analysis (WGCNA). This study aims to use bioinformatics tools to search for potential target genes in dexamethasone-induced open-angle glaucoma.
1 Materials and Methods
1.1 Main reagents
Primary human trabecular meshwork (HTM) cells (Sciencell, San Diego, CA, USA) were used for this study. The main reagents and instruments included DMEM low-glucose medium and fetal bovine serum (GIBCO, New York, USA); Trizol, Lipofectamine RNAiMAX and DAPI (Invitrogen, Carlsbad, CA, USA) and dexamethasone (Sigma, St. Louis, Missouri, USA), a BCA protein concentration detection kit (GLPBIO, China) and rabbit anti-human BDKRB1 ab75148 (Abcam, USA); mouse anti-human TAGLN sc-53932 (Santa Gruz, CA, USA) and rabbit anti-human LMOD1 1511-1-AP(Proteintech, Chicago, USA); rabbit anti-human β-actin 4970, rabbit anti-human GAPDH 5174S, goat anti-rabbit secondary antibody 7074S) and horse anti-mouse secondary antibody 7076S (CST); an ECL chemiluminescence solution (Merck Millipore, Massachusetts, USA); and an ultra-high sensitivity chemiluminescence imaging system (Bio-Rad, Hercules, CA, USA).
1.2 Methods
1.2.1 Assessment of cytobiological function of the dexamethasone treated HTM cells with different bioinformatic approaches
1.2.1.1 Using the GEO database to retrieve the dexamethasone-induced glaucoma datasets Related datasets were retrieved from the GEO database (http://www.ncbi.nlm.nih.gov/geo/ )8 using dexamethasone and open-angle glaucoma as search keywords and GSE16643, GSE37474 and GSE124114 were selected. The GSE16643 was based on the GPL6480 platform (Agilent-014850 whole human genome microarray 4x44K G4112F chip), which contained three paired samples of TM86 and TM93; GSE37474 was based on the GPL570 platform (Affymetrix human genome U133 Plus 2.0 Array chip), which contained five paired samples; and GSE124114 was based on the GPL6244 platform (Affymetrix human genome 1.0 ST Array chip), which contained nine paired samples.
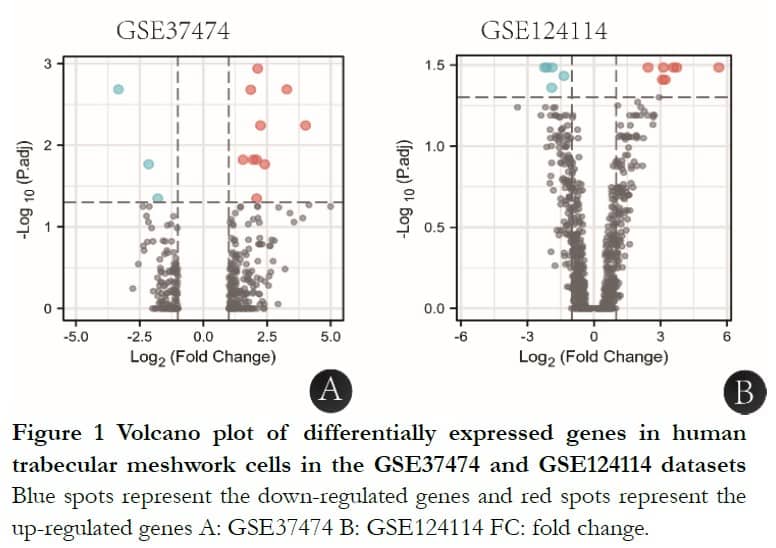
1.2.1.2 DEG analysis using GER2R tool The DEGs of GSE37474, GSE124114 and GSE16643 were obtained using the GEO2R tool. A significance level of 0.05 was set for the corrected t-test Pvalue using the Benjamin-Hochberg method. Genes with an absolute value of log2 (Fold change) >1 and adjusted Pvalue <0.05 were assigned a DEG. Volcano plots of GSE37474 and GSE124114 were created using edgeR to plot the Log2(FC) as the abscissa and -Log10(Pvalue) as the ordinate. The intersections of three gene sets were analyzed with the DAVID (http://david.ncifcrf.gov) online database9.
1.2.1.3 GSEA of GSE37474 and GSE124114 The distribution trend of genes in a pre-defined gene set in a gene table ranked by phenotype correlation via GSEA were evaluated, by judging their contribution to phenotype. The GSEA was performed with the MSigDB (c2.cp.v7.2.symbols.gmt) gene sets’-axis representing one gene set and X-axis representing the LogFC expression data in each gene set. Each gene set corresponds to one peak, with the shape of the peak representing the LogFC expression data of core molecules in each gene set and the corresponding position of peak height representing the LogFC of most molecules. In these plots, below each peak is a vertical bar representing corresponding core molecules. The more concentrated the bars, the more concentrated the data are in this interval. If the NES of a corresponding gene set was negative, the peak of that gene set would be presented to the left of zero, but if positive, then the peak of this gene set would be shown to the right of zero. A gene set was considered significantly enriched when the adjusted P-value was <0.05 and the false discovery rate (FDR) <0.2510.
1.2.1.4 Using the Genotype-Tissue Expression (GTEx) portal database to interrogate the differential gene expression of normal human fibroblasts The highest-scoring genes analyzed by GO were imported into the GTEx portal database (https://www.gtexportal.org/) to find transcripts per million (TPM) of human fibroblasts11.
1.2.1.5 Use of STRING (search tool for the retrieval of interacting genes and proteins) to study interactions among proteins STRING analysis (https://string-db.org/)12 was used to analyze intersections of GSE16643,GSE37474 and GSE124114 and construct their protein-protein interaction (PPI), when they were greater than 0.4. A PPI diagram was drawn using Cytoscape software v3.6.613 and hub nodes were found14.
1.2.1.6 Using JASPAR and UCSU databases to find relative transcription factors The differential genes were imported into UCSC (genome-asis.ucsu.edu/index.html)15 to find a promoter sequence and subsequently search the potential transcription factor-binding sites with JASPAR database (https://jaspar.genereg.net)16.
1.2.2 Observing the effect of dexamethasone on HTM cells
1.2.2.1 Cell culture and grouping Primary human trabecular meshwork cells at passage two to six after resuscitation were cultured in DMEM-low glucose media containing 10% fetal bovine serum in a CO2 incubator at 37°C and 5% humidity. After reading 90% confluency, the cells were subcultured, then divided into two groups. The experimental grouPhad 2 mL of 500 nmol/L dexamethasone added and the control grouPhad the same amount of ethanol. Both groups were cultured for 7 days and the experiment was repeated three times.
1.2.2.2 Using western blot to detect BDKRB1 and TAGLN protein expression A protein lysate kit was used to extract cell total protein and a BCA protein concentration detection kit to measure protein concentration. Polyacrylamide gel electrophoresis was employed to isolate different molecular weight proteins and proteins were transferred to PVDF membranes, which were then blocked by BSA blocking liquid for 10 min Primary antibody BDKRB1(1:800), TAGLN(1:500), LMOD1(1;1000), β-actin(1:2000) and GAPDH (1:2000) were incubated with membranes overnight at 4°C. After washing with TBST buffer, the membranes were incubated with a second antibody for 1 hour, and ECL chemiluminescence solution allowed images of membranes to be acquired by a gel imaging system. ImageJ software was used to analyze band grayscale and calculate the relative expression of target proteins with β-actin and GAPDH as references.
1.3 Statistical Methods
SPSS 20.0 and GraphPad Prism 7 were used for analysis. The measurement data was verified to be normally distributed with the Shapiro-Wilk test in term of mean and standard deviation ( ±s). The independent samples t-test was used to measure BDKRB1and TAGLN relative protein expression for the experimental and control groups. P<0.05 was regarded as statistical significance.
2 Results
2.1 Datasets processing and DEGs screening
After GEO2R analysis, GSE37474 had 15 significant DEGs with 12 upregulated and three downregulated genes and GSE124112 had 13 significant DEGs with eight upregulated and five downregulated genes, shown in Figure 1.
2.2 Enrichment analysis of GSE37474 and GSE124114 with GSEA
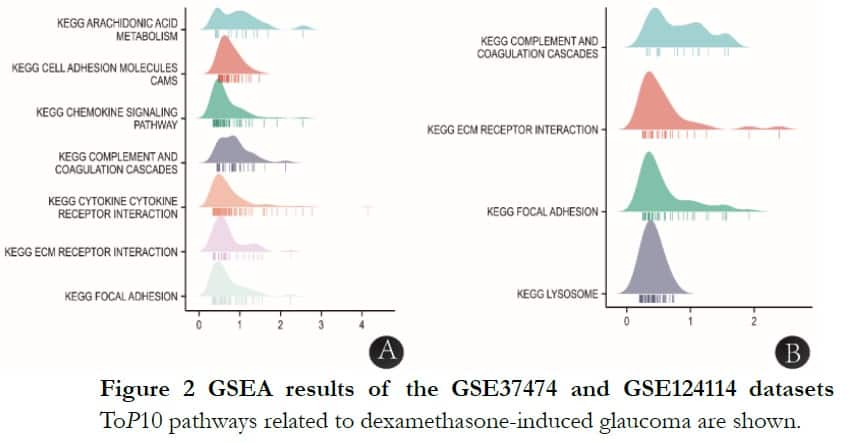
The significantly enriched genes sets were set at a default cut-off of P-value <0.05 and FDR <0.25. Eligible datasets of GSE37474 and GSE124114 were 250 and 71, respectively. In GSE37474, there were seven datasets ranked in the toP10 in connection with dexamethasone-induced glaucoma-KEGG arachidonic acid metabolism: cell adhesion molecules, chemokine signaling pathway, complement and coagulation cascades, cytokine receptor interaction, ECM receptor interaction and focal adhesion. In GSE124114,there were four datasets ranked in the toP10 in connection with dexamethasone-induced-KEGG complement and coagulation cascades: ECM receptor interaction, focal adhesion and lysosomes. The common signaling pathways were KEGG complement and coagulation cascades, ECM receptor interaction and focal adhesion, as shown in Figure 2.
2.3 DEGs and function of different datasets
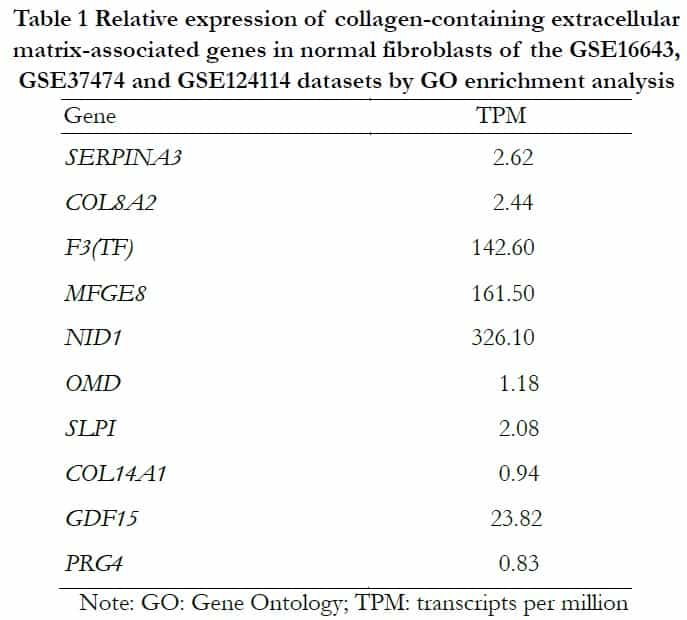
According to the information of samples and data matrix, 89 intersectional differential genes of GSE37473, GSE124114 and GSE16643 were obtained by Venn diagrams. These genes mainly participated in the process of extracellular structure and matrix formation using analysis from the DAVID online website. The KEGG analysis showed that three signal pathways including tyrosine metabolism, drug metabolism-cytochrome P450 and fatty acid biosynthesis were associated with the target genes. The extracellular matrix genes that had the highest score and contained collagens were imported into the GTEx portal database to determine whether they existed in human fibroblasts (Table 1).
2.4 Core genes and function of DEGs
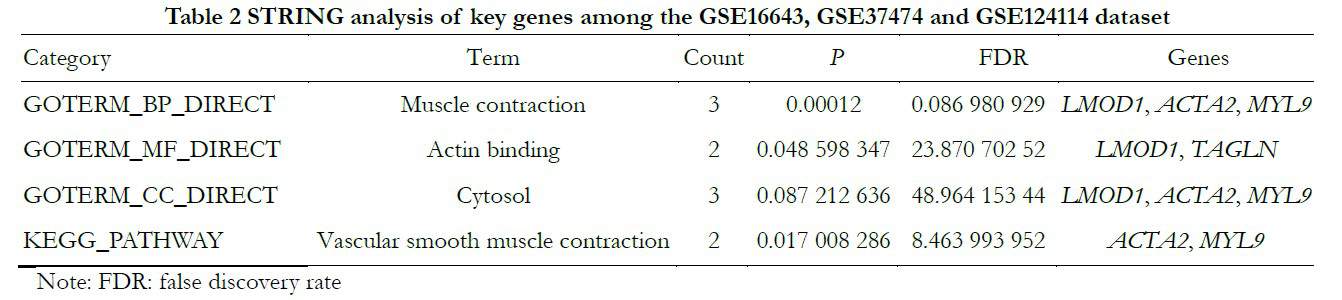
To identify core genes from the intersections of 89 DEGs, the DEGs were analyzed further using the STRING online database. The genes LMOD1, ACTA2 and MYL9 were related to muscle contraction and cytosol; LMOD1 and TAGLN were connected with actin binding and ACTA2 and MYL9 were related to vascular smooth muscle contraction, as shown in Table 2 and Figures 3 and 4.
2.5 Transcription factors related to BDKRB1, NID1, MFGE8 and TAGLN
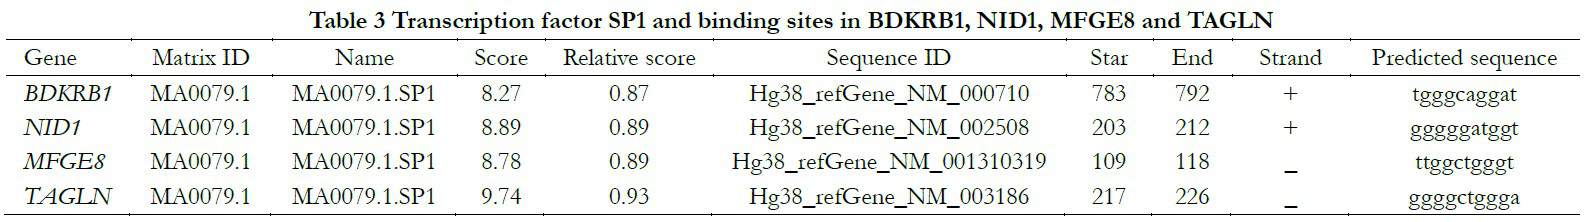
Genetic promoter regions of BDKRB1, NID1, MFGE8 and TAGLN found in the UCSC database were employed to match corresponding transcription factors in the JASPAR online database. The common transcription factor Sp1 and combining sequence were predicted in Table 3.
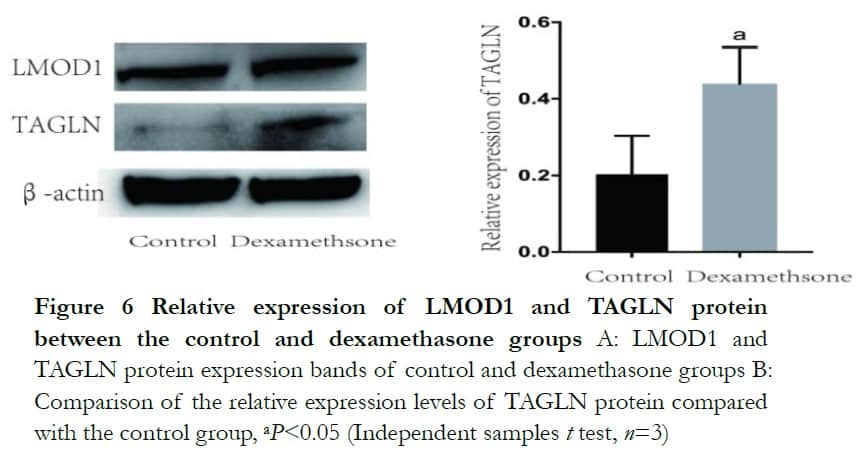
2.6 Comparison of relative protein expression of BDKRB1, TAGLN and LMOD1 in different groups
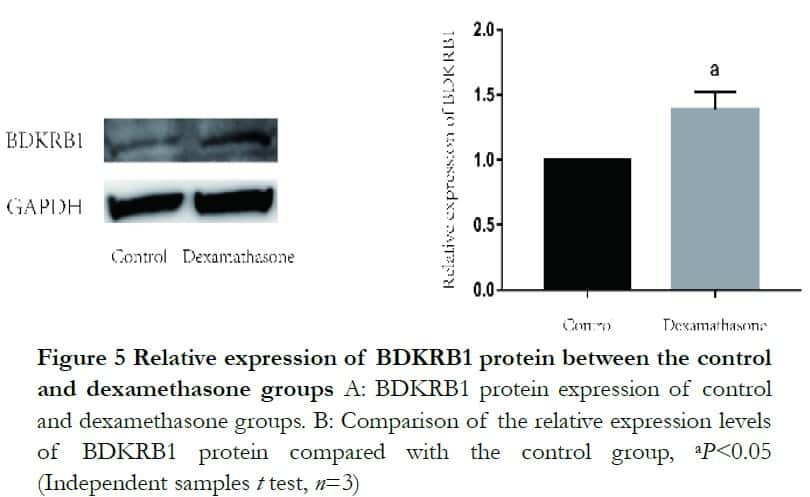
Western blot analysis revealed that both BDKRB1 and TAGLN protein levels were significantly enhanced after dexamethasone treatment. The relative expression levels of BDKRB1 and TAGLN proteins were 1.32±0.14 and 0.44±0.09 in the dexamethasone group, which were significantly higher than 1.00±0.00 and 0.20 ±0.10 in the control group, respectively, where t=−3.61 and 2.89 (P<0.05). The relative protein expression of LMOD1 was 0.56±0.02 and 0.49±0.07 and it was not statistically significant, where t=−1.71 (P>0.05) (Figures 5 and 6).
3 Discussion
Dexamethasone is essential for the clinical treatment of glaucoma but its side-effects are getting more and more attention, especially the effect on aqueous humor outflow. The GSE37474 selected in this study came from the average age of 65 years old, while the GSE124114 came from the young people with an average age of 25 years old, but the GSEA results showed that the gene enrichment changes of the two groups were similar. We chose BDKRB1 in the enrichment analysis ranked in the toP10 list and the complement and coagulation cascades pathway to analyze the relative protein expression between experimental and control groups.
Western blot results showed that BDKRB1increased in the dexamethasone treated group. BDKRB1 belongs to components of the kinin-kallikrein system. A kinin is a small molecular polypeptide, involved in inflammation and molecular regulators in an injured body. Bradykinin(BK), lys-BK, desArg9-BK and lys-desArg9-BK exert their actions via BDKRB1 and BDKRB2 distinct receptor subtypes. Lys-BK and desArg9-BK can activate BDKRB1. BK and Lys-BK can activate BDKRB2. Both receptors belong to 7-transmenbrane domain G-protein-coupled transmembrane proteins17. BDKRB2 is widely distributed and regulates most biological activities of bradykinin and BDKRB1 is barely detectable in the normal brain and spinal cord, but it is markedly up-regulated in inflammation or after tissue injury18 but is not currently reported in HTM cells. This study showed that after dexamethasone treatment, BDKRB1 increased compared with that of the control grouPand suggested that this protein could be used to evaluate the degree of inflammatory activity.
In this study, DEG intersections of the GSE3747,GSE124114 and GSE16643 datasets were utilized and two new genes, TAGLN and LMOD1, related to the cytoskeleton were successfully found using the STRING online database. The study by Leung et al19 showed TAGLN expression in a dexamethasone grouPwas detected as significantly higher than that of the control grouPin microarray experiments. TAGLN belongs to the calponin protein family, which encodes an activator protein binding protein sensitive to mophologic changes, but the specific function still needs to be studied further. LMOD1, which is highly expressed in the thyroid, is a protein that can control vascular and visceral smooth muscle contraction. LMOD1 exists in various tissues such as ocular muscle, skeletal muscle and ovarian tissue and has mainly been reported in Graves’ disease and thyroid relative ocular disease20. LMOD1 in the pathogenesis of glaucoma has not been reported. The current study showed that TAGLN, but not LMOD1, was more highly expressed in the experimental group. According to the result of the STRING protein-protein interaction network, TAGLN had connection with ACTA2, which suggested TAGLN participated in cytoskeleton changes following dexamethasone treatment of HTM cells.
The GO analysis revealed DEGs are mainly associated with extracellular matrix containing collagen. Excessive collagen is known to obstruct aqueous humor outflow resulting in an increase of intraocular pressure21. Genes ranked highest in GO enrichment analysis were compared with those of normal fibroblasts in the GTEx portal database and it was found that fibroblasts expressed the above genes and TGF was produced increasingly in dexamethasone treated HTM cells, which would transform HTM cells into myofibroblasts22. Myofibroblasts make a critical contribution to the formation of collagen. In response to injured tissues and organs, fibroblasts normally differentiate into myofibroblasts to repair or replace damaged extracellular matrix through production, secretion and contraction of collagen. If this process is dysregulated, fibrosis occurs, and suggests that the process of endothelial-mesenchymal transition (EMT) exists in injured HTM cells following dexamethasone treatment.
The results also showed that the transcription factor SP1 had a relationshiPwith BDKRB1, NID1, MFGE8 and TAGLN. The SP1 gene encodes a zinc finger protein that functions as a transcription factor regulating cell differentiation, transformation, growth, apoptosis, immune response, DNA damage response and chromatin remodeling23.
Vimentin is the intermediate product of myofibroblast formation and SP1 is also a common transcription factor of vimentin and ACTA2, a biomarker of myofibroblasts. Although SP1 has a pivotal role in the development of both rodent and human embryos, it decreases gradually with age in normal tissues, but in some diseases such as cancer it shows the opposite effect24. Studies have found that the downregulation of SP1 can reduce the risk of transformation from fibrosarcoma to fibroma in athymic mice25. Jim et al found SP1 could mediate the transcription of miR-4295, which targeted the 3’UTR of p63a mRNA and consequently inhibited p63a translation, promoting the transformative development of urothelial epithelial cells to tumors26. Oncogenic KRAS protein contributes to malignant transformation in human cancers, which is mediated by SP1-suppression of the miR-200 family. The miR-200 family antagonizes oncogenic KRAS-induced malignant transformation in vitro and in vivo27. The expression of BMI and SP1 were upregulated in Pemetrexed-resistant A400 but not A549 non-small cell lung cancer cells (NSCLC) and miR-145-5Pwas downregulated. miR-145-5Pis widely regarded as a tumor suppressor miRNA and Sp1 is a direct target of miR-145-5Pin NSCLC cells. Overexpression of SP1 decreases pemetrexed sensitivity and induces the EMT program28. Given that SP1 had the mesenchymal transition characteristics in the above studies, it is hypothesized that SP1 might promote the EMT program in HTM cells following dexamethasone treatment.
This study used a series of bioinformatic tools to search changes of dexamethasone treated cells and an analysis of literature to find their common upstream targets and this finding should provide novel therapeutics for glucocorticoid-induced glaucoma. However, bioinformatics analyses were made only from databases, so further experiments are needed for validation.
Conflicts of Interests None declared.
Author Contributions Liu Liling: Conceptualization; Li Deling, Zeng Weiting, Zhang Xinyi: Data curation;, Liu Liling, Li Deling: Formal analysis;, Liu Liling: Writing original draft ; Xu Jiangang, Yu Minbin: Writing review and editing; Yu Minin: Supervision. All authors have read and agreed to the published version of the manuscript.
References
- Galon, J., et al., Gene profiling reveals unknown enhancing and suppressive actions of glucocorticoids on immune cells. Faseb j, 2002. 16(1): p. 61-71.
- Raghunathan, V.K., et al., Dexamethasone Stiffens Trabecular Meshwork, Trabecular Meshwork Cells, and Matrix. Invest Ophthalmol Vis Sci, 2015. 56(8): p. 4447-59.
- Mohd Nasir, N.A., et al., Effect of dexamethasone on the expression of MMPs, adenosine A1 receptors and NFKB by human trabecular meshwork cells. J Basic Clin Physiol Pharmacol, 2020. 31(6).
- Honjo, M., et al., Role of the Autotaxin-LPA Pathway in Dexamethasone-Induced Fibrotic Responses and Extracellular Matrix Production in Human Trabecular Meshwork Cells. Invest Ophthalmol Vis Sci, 2018. 59(1): p. 21-30.
- Clark, R., et al., Comparative genomic and proteomic analysis of cytoskeletal changes in dexamethasone-treated trabecular meshwork cells. Mol Cell Proteomics, 2013. 12(1): p. 194-206.
- Hoare, M.-J., et al., Cross-Linked Actin Networks (CLANs) in the Trabecular Meshwork of the Normal and Glaucomatous Human Eye In Situ. Investigative Opthalmology & Visual Science, 2009. 50(3).
- Duffy, L. and S. O’Reilly, Functional Implications of Cross-Linked Actin Networks in Trabecular Meshwork Cells. Cell Physiol Biochem, 2018. 45(2): p. 783-794.
- Barrett, T., et al., NCBI GEO: archive for functional genomics data sets–update. Nucleic Acids Res, 2013. 41(Database issue): p. D991-5.
- Huang da, W., B.T. Sherman, and R.A. Lempicki, Bioinformatics enrichment tools: paths toward the comprehensive functional analysis of large gene lists. Nucleic Acids Res, 2009. 37(1): p. 1-13.
- Subramanian, A., et al., Gene set enrichment analysis: a knowledge-based approach for interpreting genome-wide expression profiles. Proc Natl Acad Sci U S A, 2005. 102(43): p. 15545-50.
- Human genomics. The Genotype-Tissue Expression (GTEx) pilot analysis: multitissue gene regulation in humans. Science, 2015. 348(6235): p. 648-60.
- Szklarczyk, D., et al., STRING v10: protein-protein interaction networks, integrated over the tree of life. Nucleic Acids Res, 2015. 43(Database issue): p. D447-52.
- Smoot, M.E., et al., Cytoscape 2.8: new features for data integration and network visualization. Bioinformatics, 2011. 27(3): p. 431-2.
- Chin, C.H., et al., cytoHubba: identifying hub objects and sub-networks from complex interactome. BMC Syst Biol, 2014. 8 Suppl 4(Suppl 4): p. S11.
- Kent, W.J., et al., The human genome browser at UCSC. Genome Res, 2002. 12(6): p. 996-1006.
- Castro-Mondragon, J.A., et al., JASPAR 2022: the 9th release of the open-access database of transcription factor binding profiles. Nucleic Acids Res, 2022. 50(D1): p. D165-d173.
- Regoli, D. and J. Barabé, Pharmacology of bradykinin and related kinins. Pharmacol Rev, 1980. 32(1): p. 1-46.
- Shughrue, P.J., B. Ky, and C.P. Austin, Localization of B1 bradykinin receptor mRNA in the primate brain and spinal cord: an in-situ hybridization study. J ComPNeurol, 2003. 465(3): p. 372-84.
- Leung, Y.F., et al., The dual role of dexamethasone on anti-inflammation and outflow resistance demonstrated in cultured human trabecular meshwork cells. Mol Vis, 2003. 9: p. 425-39.
- Hrdá, P., et al., [Endocrine orbitopathy and significance of autoantibodies against 1D protein]. Cas Lek Cesk, 2007. 146(3): p. 273-7.
- Last, J.A., et al., Elastic modulus determination of normal and glaucomatous human trabecular meshwork. Invest Ophthalmol Vis Sci, 2011. 52(5): p. 2147-52.
- Pattabiraman, P.P., R. Maddala, and P.V. Rao, Regulation of plasticity and fibrogenic activity of trabecular meshwork cells by Rho GTPase signaling. J Cell Physiol, 2014. 229(7): p. 927-42.
- O’Connor, L., J. Gilmour, and C. Bonifer, The Role of the Ubiquitously Expressed Transcription Factor Sp1 in Tissue-specific Transcriptional Regulation and in Disease. Yale J Biol Med, 2016. 89(4): p. 513-525.
- Oh, J.E., J.A. Han, and E.S. Hwang, Downregulation of transcription factor, Sp1, during cellular senescence. Biochem Biophys Res Commun, 2007. 353(1): p. 86-91.
- Lou, Z., et al., Down-regulation of overexpressed sp1 protein in human fibrosarcoma cell lines inhibits tumor formation. Cancer Res, 2005. 65(3): p. 1007-17.
- Jin, H., et al., XIAPRING domain mediates miR-4295 expression and subsequently inhibiting p63α protein translation and promoting transformation of bladder epithelial cells. Oncotarget, 2016. 7(35): p. 56540-56557.
- Zhong, X., et al., Suppression of MicroRNA 200 Family Expression by Oncogenic KRAS Activation Promotes Cell Survival and Epithelial-Mesenchymal Transition in KRAS-Driven Cancer. Mol Cell Biol, 2016. 36(21): p. 2742-2754.
- Chang, W.W., et al., miR-145-5PTargets Sp1 in Non-Small Cell Lung Cancer Cells and Links to BMI1 Induced Pemetrexed Resistance and Epithelial-Mesenchymal Transition. Int J Mol Sci, 2022. 23(23).