·Experimental Research·
Promoting effect of miR-15a on high glucose-induced oxidative stress in human lens epithelial cells and its mechanism
Nan Anchao, Nan Jianru, Liu Yadong, Liu Xiangling
Department of Ophthalmology, the Second Affiliated Hospital of Zhengzhou University, Zhengzhou 450014, China
Corresponding author: Nan Anchao, Email: nananchao0208@163.com
Abstract [View PDF in English] [View PDF in Chinese] [Read Full Text]
Objective To investigate the effect and mechanism of microRNA-15a (miR-15a) on relieving oxidative stress in human lens epithelial cells (LEGs) after hyperglycemia.
Methods Donor anterior lens capsule specimens were collected from patients with normal cataract and patients with diabetic cataract (DC) following phacoemulsification. After culturing human lens epithelial cell line HLEB-3 cells with 0,10, 20, or 50 mmol/L glucose for 24 hours, expression of miR-15a was detected by real-time quantitative PC (RT-qPCR). Western blot determined the expression of silent information regulator 1 (SIRT1), forkhead transcription factor 3a (FOXO3a), and p53 protein. Cell apoptosis was assayed by flow cytometry. HLEB-3 cells were transfected with miR-15a control or miR-15a inhibitor, then incubated with 50 mmol/L glucose for 24 hours. Cell apoptosis was detected through flow cytometry. Endogenous reactive oxygen species (ROS) expression in the transfected cells was determined by 2, 7-dichlorodihydrofluorescein diacetate (DCFH-DA). Total antioxidant capacity (T-AOC), superoxide dismutase (SOD), and glutathione peroxidase (GSH-Px) activities as well as malondialdehyde (MDA) concentration were measured. The relationship between miR-15a and SIRTI was verified by dual-luciferase reporter assay. The SIRT1, FOXO3a, and p53 protein expressions in the transfected cells were detected by Western blot. This study was approved by the Ethics Committee of the Second Affiliated Hospital of Zhengzhou University (No. ZDEFY201803160023). Written informed consent was obtained from each subject.
Results Expression of miR-15a was higher in DC cells (0.21+0.02 versus 0.96 +0.10), (t=12.231, P<0.001) and SIRT1 expression was higher in controls (0. 89+0. 09 versus 0.31 +0.05) (t=8.964, P<0.001). After glucose incubation, rate of apoptosis, ROS content, and MDA concentrations were higher in miR-15a controls than miR-15a inhibitor group, and activities of T-AOC, SOD, and GSH-Px were lower in miR-15a control group than miR-15a inhibitor group, with statistically significant differences (all at P<0.05). Luciferase activity of the SIRT1-3’-untranslated region (UTR)-wild type (WT) reporter gene in miR-15a controls was significantly lower than the miR-15a inhibitor group (t=5.978, P=0.004). No significant difference was found in the luciferase activity of the SIRT1-3’-UTR-mutant type (MUT) reporter gene (t =0.432, P=0.688). The expression of FOXO3a and p53 proteins were significantly higher in miR-15a controls than miR-15a inhibitor groups, and relative expression of SIRT1 protein was significantly lower in miR-15a control group than miR-15a inhibitor group (all at P<0. 05).
Conclusions Induction of miR-15a can damage LEC’s exposed to high glucose by limiting anti-oxidative capacity. This may be achieved by inhibiting SIRT1 expression which, in turn, up-regulates FOXO3a and p53, and induces apoptosis.
Key words: Oxidative stress, Cataract, Diabetic; Epithelial cells, Lens, microRNA-15a; Silent information regulator 1; Apoptosis
Fund program: Henan Province Medical Science and Technology Research Project (20160215)
DOI: 10.3760/cma.j.cn115989-20200301-00126
Diabetic cataract (DR) is an opacification of the crystalline lens brought about by diabetes, and is a common cause of blindness. It tends to progress rapidly than normal cataract and is appears larger than in normal cataracts. In clinical practice, DC is mainly treated surgically, but postoperative complications are common. [1] Therefore, research clarifying the underlying pathogenesis is important for the evolution of targeted medical therapies. Oxidative stress and subsequent reactive oxygen species (ROS) in the lens epithelial cells (LECs) are the main cause of lens opacification in high glucose environments. [2]. If ROS production exceeds its clearance, free radicals accumulate which cause cell and tissue damage. [3-4]
MicroRNAs (miRNA) are non-coding RNAs that recognize the 3’-untranslated regions in target genes. By fully or partially binding with the target gene, miRNA can lead to gene degradation or inhibit its translation. [5] Recent studies have found that numerous miRNAs play important roles in oxidative injury of LECs and the development of cataracts. [6-7] As a member of the miRNA family. miR-15a is highly expressed in LECs of cataract patients and induces apoptosis of LECs. [8] Cho et al. [9] reported miR-15a was one of the most differentially expressed miRNAs in the aqueous humor of patients with diabetic macular edema however the association between miR-15a and DC development remains unclear.
Therefore, this study investigated the expression of miR-15a in LECs of DC patients and explore its effect on the antioxidant ability of LECs under high glucose environments. The resulting findings will provide experimental evidence for DC mechanisms and unveil potential therapeutic targets.
1 Materials and Methods
1.1 Materials
1.1.1 Specimens and cells From May 2018 to October 2019, a total of 26 anterior lens capsule membrane specimens were collected from 26 DC patients after phacoemulsification cataract extraction in The Second Affiliated Hospital of Zhengzhou University. The DC group consisted of 26 specimens (38.5% male) and mean age was 70.35 (Standard deviation [SD] 4.56). In the cataract control group 26 anterior lens capsule membrane specimens were collected from 26 healthy controls (38.5% male) with mean age of 69.73(SD=4.49). Immortalized lecshlec-B3 cell line were obtained from Shanghai Cell Bank, Chinese Academy of Sciences.
1.1.2 Main reagents and instruments DMEM medium, fetal bovine serum (FBS), total antioxidant capacity (T-AOC), superoxide dismutase (SOD), glutathione peroxidase (GSH-Px), reduced glutathione (GSH), malondialdehyde (MDA) detection kit (Shanghai Biyuntian Biotechnology Co. Ltd); miR-15a inhibitor and miR-15a control (Shanghai Jima Gene Company); 2,7-dichlorofluorescein diacetate (DCFH-DA) fluorescent probe (Sigma Company, USA); Trizol total RNA extraction kit, CK-8 kit (Hangzhou Sijiging Company); rabbit anti-human silent information regulator proteins 1 (SIRT1) antibodies (703368), rabbit anti-human Forkhead transcription factor 3a (FOXO3a) antibodies (PA5-104701), rabbit anti-human p53 antibodies (MA5-12557), goat anti-rabbit horseradish peroxidase-labelled IgG (H+L) antibodies (A32731) (Invitrogen Company, the United States); Annexin V FITC/PI apoptosis kit (BD Company, USA); Luciferase reporter gene assay kit (Abcam Company, USA). Immunofluorescence microscopy (Olympus Company, Japan); Microplate reader (Biorad Company, USA); Real-time fluorescent quantitative polymerase chain reaction (PCR) instruments (Applied Biosystems Company, USA); Ultraviolet spectrophotometer (Eppendorf Company, Germany); Flow cytometry (BD Company, USA).
1.2 Methods
1.2.1 Collection of the anterior capsule membrane (1) In the DC group, a 5.5-6.5mm anterior capsule membrane was removed after routine continuous annular capsulorhexis during phacoemulsification cataract extraction, and the specimen was rinsed with double distilled water and divided into 2 parts. Both parts were placed in cryopreservation tubes at -80 ℃. (2) In the control cataract group, the cornea was circularly cut under aseptic conditions and the eyeball was opened under the operating microscope. Then, lens suspensory ligaments, aqueous humor, vitreous bodies, adhering blood and the transparent lens were completely removed. A 5.5-6.5 mm anterior capsule membrane was torn annularly from the anterior center of the transparent lens. After the lens cortex was removed the specimen was rinsed by distilled water and divided into 2 parts. Both parts were placed in cryopreservation tubes at -80 ℃. This study was reviewed and approved by the Ethics Committee of the Second Affiliated Hospital of Zhengzhou University (No.: ZDEFY201803160023), and all participants signed the informed consent.
1.2.2 Anterior capsule membrane miR-15a assessed by real-time fluorescence quantification PCR DC and control specimens were each placed in a mortar pre-cooled with liquid nitrogen and grounded into powder. According to instructions of Trizol total RNA extraction kit, 1ml Trizol reagent was added to extract total RNA. Then, extracted RNA were reversely transcribed into cDNA. 2ul of template cDNA was used for PCR amplification. For the U6 primer, the forward sequence was 5’-GCTTAGCTTCGATCGGCTAA-3’ and the reverse sequence was 5’-GCTTAGCTAGGCCTACCAC-3’; for the miR-15a primer, the forward sequence was 5’-CGTTTCGATTGCCATTACGC-3’ and the reverse sequence was 5’-GCTTTAGGCTAGCCATGCTT-3’. All primers used in the experiments were produced by Shenggong Bioengineering (Shanghai) Co. Ltd. Amplification conditions: pre-denaturation at 94 °C for 2 min; denaturation at 94 °C for 30 s, annealing at 55 °C for 30 s, extension at 72 °C for 2 min, 35 cycles; a total of 6 min for the extension at 72 °C. Using U6 as the internal reference, the relative expression of miR-15a was calculated by the 2–ΔΔCt relative quantification method. Aforementioned procedures were repeated 3 times independently.
1.2.3 Anterior capsule membrane miR-15a f SIRT1 protein assessed by Western blot After shredding and weighing, the remaining anterior capsule membrane was put into 1ml of homogenizers and dissolved for proteolysis at a ratio of 100-200ul per 20mg. The solution was homogenized and lysed in ice water for 1 min then centrifuged at 14,000×g for 5 minutes. Supernatant was collected for detecting protein concentrations. Protein samples were added to SDS-PACE gel sample wells for electrophoresis, and transferred to PVDF membranes which were blocked by 5% nonfat dry milk at room temperature for 2 h and rinsed by TBST for 3 min. After adding SIRT1 (1:500) or β-actin (1:800) primary antibodies, the membranes were incubated overnight at 4°C and rinsed by TBST three times (10 minutes/time). Then corresponding secondary antibodies (1:1000) were added and the membranes were further incubated at room temperature for 1 hour before being rinsed by TBST. ECL luminescent solution was added to membranes and were incubated in the dark for 5 minutes before being analyzed by the chemiluminescence gel imager. Imageproplus 6.0 software was used for gray-scale analysis of bands, and β-actin was used as a reference for calculating SIRT1 expression. Aforementioned procedures were repeated 3 times independently.
1.2.4 Preparation of HLEB-3 cell oxidative stress model Cryopreserved HLEB-3 cells were thawed, and resuspended in DMEM medium containing 10% FBS before being seeded in 96-well plates. The HLEB-3 cells were then cultured in incubators (5% CO2, 37 ℃), with culture medium changed every two days. When cells were nearly 80% confluent, the original medium was replaced by DMEM, and glucose solutions of different concentrations (0, 10, 20 and 50 mmol/L) were added. After 24 hours of incubation, morphological changes of cells were observed under microscopes.
1.2.5 Cell transfection Log-phase HLEB-3 cells were seeded in 6-well plates at a density of 2 × 10⁵/well and divided into miR-15a control and inhibitor groups. According to LipofectamineTM 2000 protocols, each group was transfected. After eight-hours, cells in each group were transferred and cultured in the 50 mmol/L glucose solution.
1.2.6 Apoptosis rate assessed by flow cytometry HLEB-3 cells in both transfection groups were cultured in glucose solutions of different concentrations. After 24 hours, HLEB-3 cells were digested with trypsin and rinsed by pre-cooled PBS twice. Solutions were then centrifuged at 2000r/min (10cm radius) and the supernatant were discarded. The remaining cells were resuspended in 200ul binding buffer solutions and 5 ul Annexin V-FITC were added in the solution. After mixing, the solution was placed in the dark for 15 min. One hour before flow cytometry, 300ul binding buffer solutions and 5ul PI were added. Using the same methodology, cells of each transfection group were cultured in 50mmol/L glucose solutions for 24h, and the apoptosis rate was assessed. Aforementioned procedures were repeated 3 times independently.
1.2.7 Cellular endogenous ROS contents assessed by DCFH-DA fluorescent probes Cells were seeded in 96-well plates at a density of 1×10⁴/well and cultured in glucose solutions of different concentrations. After 24 hours the medium was aspirated and 10umol/L DCFH-DA fluorescent probe solutions were added. The mixed solutions were then incubated for 20 min before being rinsed in PBS. Fluorescence intensity was assessed by a multifunctional microplate reader and cells were photographed by a laser scanning confocal microscope. The excitation wavelength was 485 nm and the emission wavelength was 530 nm. Using the same methodology, cells of each transfection group were cultured in 50mmol/L glucose solutions for 24h and cellular endogenous ROS contents were assessed. Aforementioned procedures were repeated 3 times independently.
1.2.8 Cellular T-AOC, SOD, CSH-Px, CSH activities and MDA concentrations assessed by kits Cells in each transfection group were cultured in glucose solutions of different concentrations for 24h. According to manufacturers’ instructions, the T-AOC activity was assessed by the Iron Reduction Method, and SOD activity was assessed by the Xanthine Oxidase Method, and CSH-Px and GSH activities were assessed by the Dithiodinitrobenzoic Acid Method, and the MDA concentration was assessed by the Thiobarbiturate Method. Aforementioned procedures were repeated 3 times independently.
1.2.9 Cellular miR-15a expression assessed by real-time fluorescence quantitative PCR Cells in each transfection group were cultured in glucose solutions of different concentrations for 24h. Cellular miR-15a expression was assessed by real-time fluorescence quantitative PCR using the same procedures mentioned above in 1.2.2. These procedures were repeated 3 times independently.
1.2.10 Cellular SIRT1, FOXO3a, p53 protein expression assessed by Western blot The cells in each transfection group were cultured in glucose solutions of different concentrations for 24h. Total proteins were extracted by the RIPA lysate and assessed by Western blot using previously described methods. After adding SIRT1 (1:500), FOXO3a (1:500), p53 (1:1000) or β-actin (1:800) primary antibodies, the cells were incubated overnight at 4°C and the secondary antibodies (1:1000) were added for another one-hour incubation at the room temperature. β-actin was used as the internal reference to calculate the relative expression of each protein. Cells in each transfection group were cultured in 50 mmol/L glucose solutions for 24h. Cellular SIRT1, FOXO3a, p53 protein expression were also assessed by above methodology. Aforementioned procedures were repeated 3 times independently.
1.2.11 miR-15a target gene prediction and dual-luciferase reporter gene analysis To determine the target for the biological function of miR-15a in HLEB-3 cells, potential target genes of miR-15a were predicted using miRanda and Targetscan databases. In these databases, SIRT1 had a binding site on the 3’UTR of the miR-15a gene. The log-phase cells were seeded in 24-well plates at a density of 2×10⁵/well, and the Renila luciferase plasmid (100ng/well) was transfected as a control. According to the instruction of LipofectamineTM 2000, SIRT1-3’UTR-wild type (WT) and SIRT1-3’UTR-mutant type (MUT) was transfected into cells with miR-15a control and inhibitor. The cells were transfected for 24 h, and the luciferase activity was measured by the dual-luciferase reporter gene detection kit. Aforementioned procedures were repeated 3 times independently.
1.3 Statistical analysis
Statistical analysis was performed using SPSS19.0 statistical software. All continuous variables were presented in the form of mean and standard deviation (SD). Normal distribution was tested by the Shapiro-Wilk test and homogeneity of variance by the Levene test. A one-way analysis of variance (ANOVA) compared differences between each assessment results in glucose solutions of different concentrations. The LSD-t test was used for multiple comparisons. The independent samples t test compared differences between assessment results in the miR-15a control group and inhibit group. A P<0.05 was considered statistically significant for all analyses.
2 Results
2.1 Comparison of miR-15a and sIRT1 expression in the anterior capsule membrane
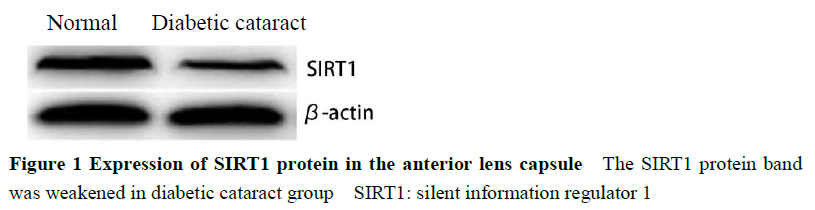
Expression of miR-15a in the control group was significantly lower than the DC group (t=12.231, P<0.001) and SIRT1 protein bands in the control group were significantly stronger than the DC group (t=8.964, P<0.001) (Figure 1, Table 1).

2.2 Morphological changes of cells in glucose solutions of different concentrations
HLEB-3 cells treated by 0 mmol/L glucose solutions were uniform in size, with smooth edges and tight adherence. After incubation with glucose cell morphology their cells shrunk, adherence was loose, and cell edges became burr-like protrusions (Figure 2).
2.3 Comparison of cellular miR-15a and SIRT1, FOXO3a and p53 protein expression in glucose solutions of different concentrations
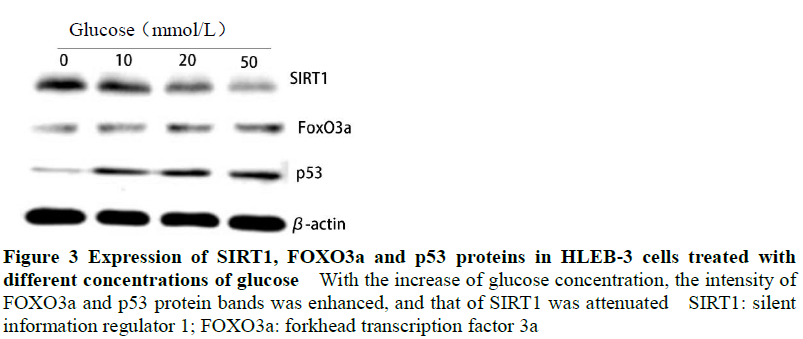
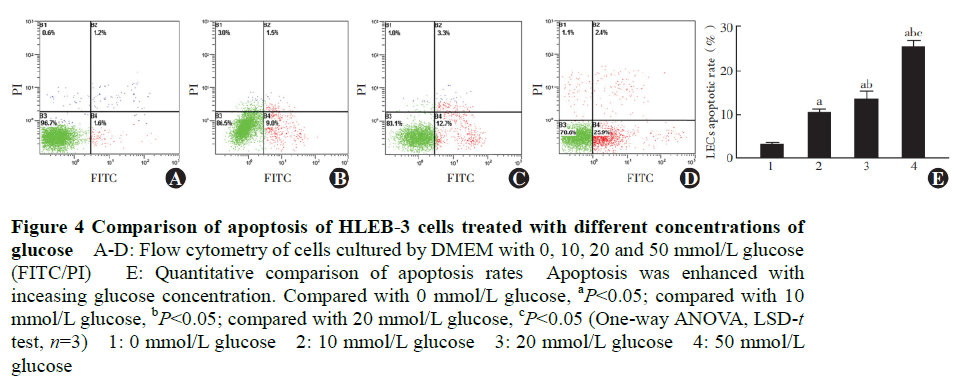
Expression of miR-15a increased with glucose concentration, and ANOVA was statistically significant (F=38.904, P<0.001). Gray values of FOXO3a and p53 protein bands increased with the glucose concentration while SIRT1 values reduced. Between cells with differing glucose concentration, relative expressions of FOXO3a, p53 and SIRT1 proteins were significantly different (F=50.771, 67.135, 45.534, all P<0.001). The relative expression levels of miR-15a, F0x03a, p53 and sIRT1 were also significantly different in cells cultured in glucose solutions of different concentrations (all P<0.05) (Figure 3, Table 2).
2.4 Comparison of apoptosis rate of cells in glucose solutions of different concentrations
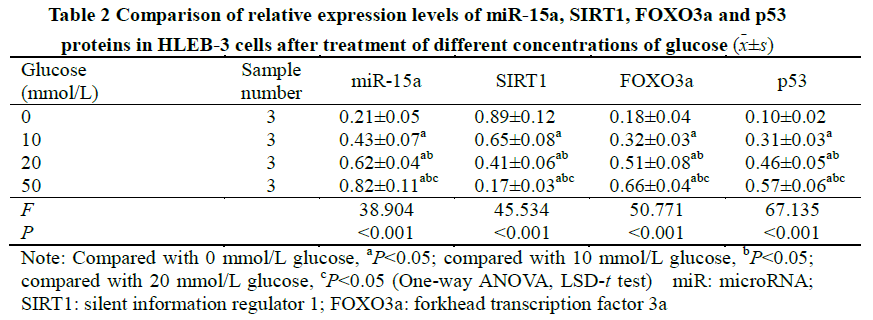
Rates of apoptosis in, 10, 20 and 50 mmol/L glucose solutions were 3.02±0.47%, 10.20±0.91%, 13.32±2.01% and 25.40±1.46% respectively, and their differences were statistically significant (F=13.311, P<0.001). Following incubation with glucose, apoptosis rate increased significantly between groups (all P<0.05) (Figure 4).
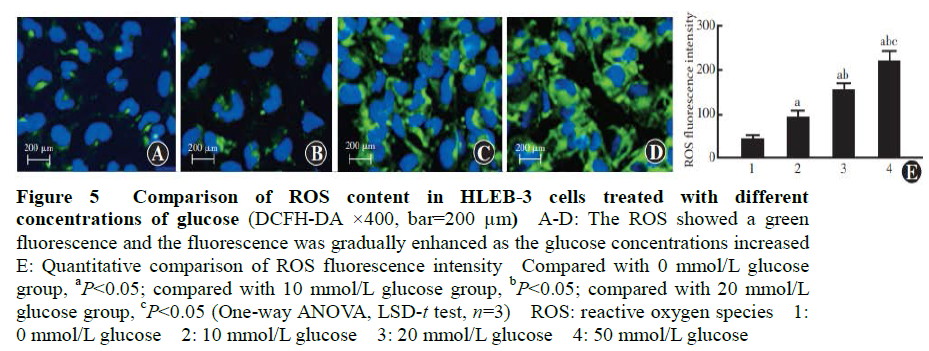
2.5 Comparison of ROS expression of cells in glucose solutions of different concentrations
The fluorescence intensity of endogenous ROS in cells with 0, 10, 20 and 50 mmol/L glucose solutions was 42.12±10.32, 92.43±15.65, 153.65±17.43 and 218.65±24.83, respectively (F=11.320, P<0.001). Fluorescence intensity of ROS significantly increased with glucose concentration (all P<0.05) (Figure 5).
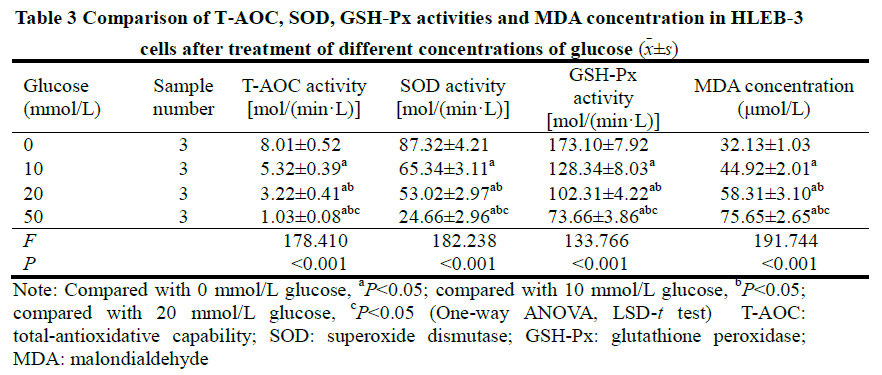
2.6 Comparison of T-AOC, SOD, GSH-Px activities and MDA concentration of cells in glucose solutions of different concentrations
Significant differences were observed when comparing T-AOC, SOD, GSH-Px activities and MDA concentration between differing glucose concentrations (F=178.410, 182.238, 133.766, 191.744, all P<0.001). Activities of T-AOC, SOD, GSH-Px were reduced, however, the concentration of MDA increased. Differences between groups were statistically significant (all P<0.05) (Table 3).
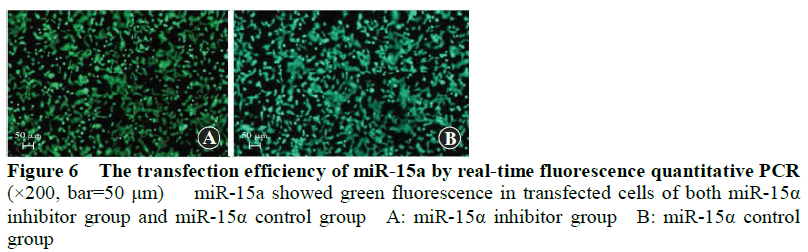
2.7 Comparison of transfection efficiency between transfection groups
The cyto-fluorescence map showed transfection was successful in miR-15a inhibitor and expression groups. Transfection rates were 90.7% and 93.5%, respectively (Figure 6).
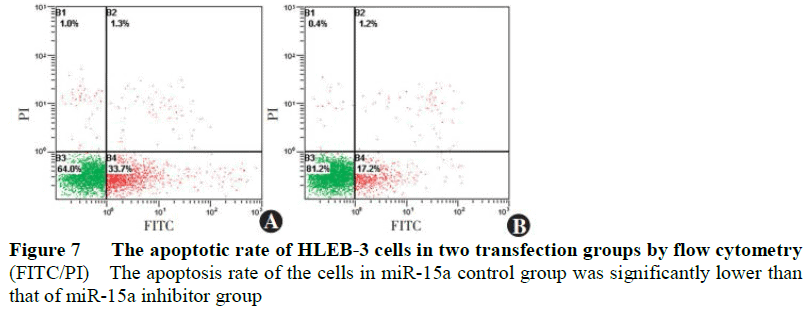
2.8 Comparison of apoptosis rate of cells between transfection groups
The apoptosis rate of the miR-15a control group was 35.22%+2.04, and significantly lower than that of the miR-15a inhibitor group (17.3%+1.05) (t=10.320, P<0.001) (Figure 7).
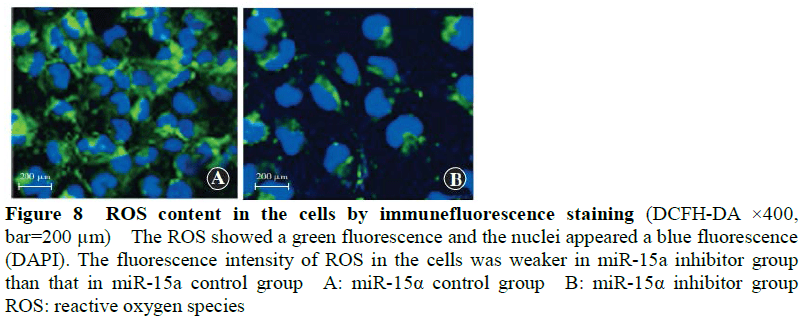
2.9 Comparison of ROS expression in cells between transfection groups
The fluorescence intensity of ROS in the miR-15a inhibitor group was 63.22+7.31, and significantly lower than the that in the miR-15a expression group (135.31+12.33) (t=14.422, P<0.001) (Figure 8).
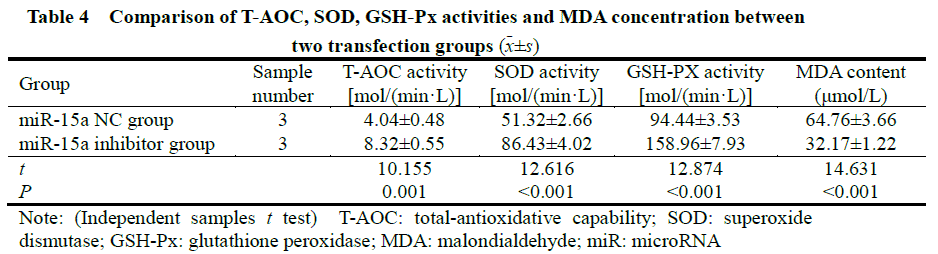
2.10 Comparison of T-AOC, SOD, GSH-Px activities and MDA concentration between transfection groups
The activities of T-AOC, SOD, GSH-Px in the miR-15a expression group were significantly lower than the miR-15a inhibitor group (t=10.155, 12.616, 12.874, all P<0.001). MDA concentration was significantly higher than that in the miR-l5a inhibitor group (t=14.631, P<0.001) (Table 4).
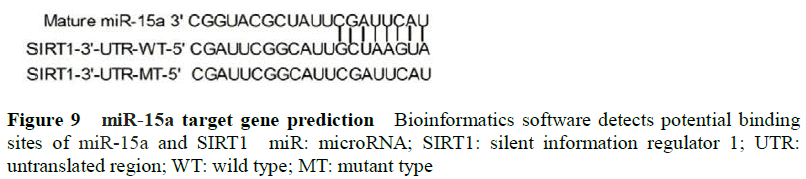
2.11 miR-15a target gene prediction
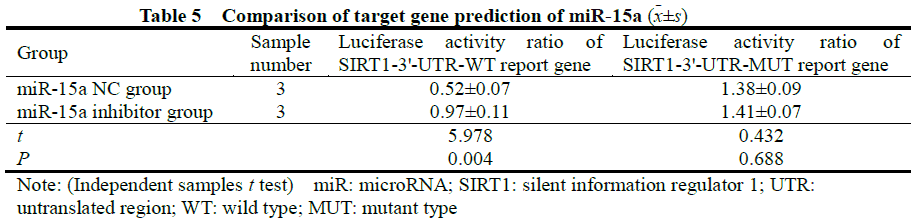
The target gene prediction of miR-15a found that miR-15a had a high degree of binding to the sites on SIRT1, and SIRT1 was a potential target of miR-15a (Figure 9). Dual-luciferase reporter system results showed that luciferase activity of the SIRT1-3’-UTR-WT reporter gene in the miR-15a control group was significantly lower than that in the miR-15a inhibitor group, and the difference was statistically significant (t=5.978, P =0.004). There was no significant difference in the luciferase activity of the SIRT1-3’-UTR-MUT reporter gene between the two groups (t=0.432, P=0.688) (Table 5).
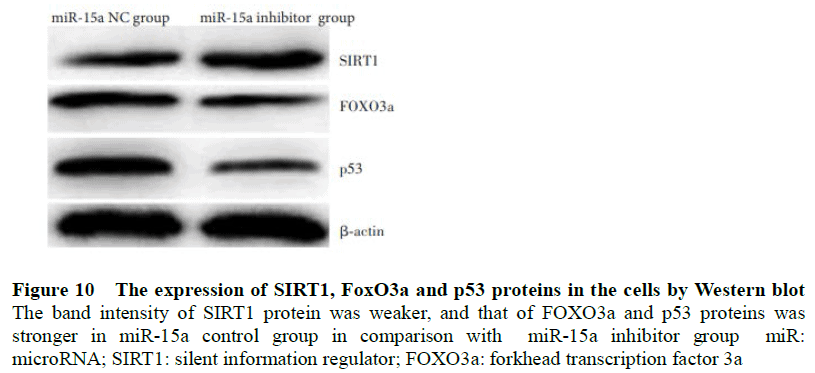
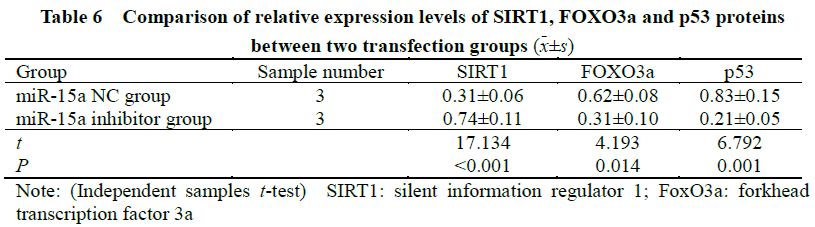
2.12 Comparison of protein expression of SIRT1, FOXO3a and p53 in HLEB-3 cells between transfection groups
The gray value of SIRT1 protein bands in the miR-15a expression group was weaker than that in the miR-15a inhibitor group, and the relative gray values of the FOXO3a and p53 protein bands were stronger than those in the miR-15a inhibitor group. Statistically significant differences in expression of p53 protein was observed (t=17.134, 4.193, 6.792, all P<0.001) (Figure 10, Table 6).
3 Discussion
The role of miRNAs in the occurrence and development of diabetic cataracts has attracted increasing attention. This study found the expression of miR-15a in the anterior capsule membranes of DC patients was higher than in controls, and expression of miR-15a in HLEB-3 cells was elevated under hyperglycemic conditions. These findings support other studies that investigate the relationship between diabetes and miRNAs, including Shi et al. [10] who found miR-15a was involved in the occurrence of diabetic retinopathy through bidirectional regulation of inflammation and angiogenesis, and Li et al. [11] who found hsa-miR-15a expression in normal LECs was lower in age-related cataract patients, and affected the proliferation, apoptosis and migration of LECs [12]. In summary, expression of miR-15a may be involved in the pathogenesis of cataracts.
Oxidative stress in LECs induced by high glucose environments is thought to be a main cause of lens opacity in DC patients [13]. Under oxidative stress, ROS accumulate in LECs and inactivation of antioxidant enzymes results in oxidative metabolite accumulation, causing cytotoxic damage and cell apoptosis. [14-15] This study observed apoptosis rate, ROS and MDA increased with glucose concentration in HLEB-3 cells, and observed simultaneous reductions in SOD, CAT, and GSH-Px activity.
MiR-15a has been suggested to play an important role in oxidative stress among different diseases. Kamalden et al. [16] found that miR-15a aggravated diabetes by inducing oxidative stress injury and Cao et al. [17] confirmed that miR-15a may have a regulatory effect on hyperoxia-induced pulmonary oxidative stress injuries. This study found the apoptosis rate of HLEB-3 cells in the miR-15a inhibitor group was significantly lower than that in the miR-15a control group, and the activity of ROS and the concentration of MDA in the miR-15a inhibitor group were significantly lower than in the miR-15a control group. In addition, the activity of SOD, CAT, and GSH-Px in the miR-15a inhibitor group was significantly higher than that of the miR-15a control group, congruent with the hypothesis that miR-15a might induce apoptosis through inhibiting anti-oxidative factors. These also show to impact HLEB-3 cells, which this study suggests may contribute to pathogenesis of DC.
SIRT1 is also thought to regulate the activity of downstream transcription factors including p53 and FOXO through histone deacetylation to reduce mitochondrial damage and mitigate oxidative stress injury in endothelial cells. The current study found under oxidative stress, SIRT1 expression was inhibited which subsequently led to rise in expression of FOXO3a and p53. Through miRanda and Targetscan, SIRT1 was also identified as a potential target of miR-15a. This is congruent with the findings of [18-19] Zeng et al. [20] who confirmed that SIRT1 expression was down-regulated in LECs of DC mice, and Liu et al. [21] who found it was down-regulated diabetic rats’ retinas, and its expression gradually decreased with severity of diabetic disease. The current study also found expression of SIRT1 in HLEB-3 cells with miR-15a inhibition was significantly increased compared with controls, and FOXO3a and p53 were significantly reduced in the miR-15a inhibited group. SIRT1 is thought to increase FOXO3a’s transcriptional activity and its downstream targets, thereby regulating cell proliferation, apoptosis, antioxidant capacity and ultimately protecting cells from oxidative stress [22] Previous studies confirm that the expression of FOXO3a in LECs treated with high glucose solutions increased in a dose and time dependent pattern, inferring it could be a biomarker of oxidative stress under hyperglycemia. [23] The cell cycle regulator, p53, is another important downstream substrate of SIRT1, which is activated by oxidative stress to induce cell apoptosis. Therefore, deacetylation of p53 by SIRT1 reduces its mediated transcriptional activation, and inhibits cell apoptosis. [24] Taken together, these findings indicate miR-15a inhibited SIRT1 transcription, while upregulating expression of downstream FOXO3a and p53 which made HLEB-3 cells more vulnerable to oxidative injury and subsequent apoptosis.
In summary, these findings indicate miR-15a inhibits anti-oxidative capacity in LECs under high glucose conditions. In addition, transcription of miR-15a likely inhibits SIRT1 expression, and activates downstream substrates FOX03a and p53, which induce cell apoptosis.
Conflicts of interest: All authors declared no conflict of interests.
Author Contribution Statement: Nan Anchao: design and implementation, article writing; Nan Jianru, Liu Yadong: data collection and analysis; Liu Xiangling: article proofreading and revision
References
[1] Xu ML, Ding YX, Ma LW, et al. Early changes in corneal endothelial cells after phacoemulsification and intraocular lens implantation in diabetic patients[J]. J China Med Univ, 2020, 49(12):1133-1135. DOI: 10.12007/j.issn.0258-4646. 2020.12.016.
[2] Liu X, Zhao X, Cheng R, et al. Autophagy attenuates high glucose-induced oxidative injury to lens epithelial cells[J/OL]. Biosci Rep, 2020, 40(4): BSR20193006[2021-05-18]. http://www.ncbi.nlm.nih.gov/pubmed/32186721. DOI: 10.1042/BSR20193006.
[3] Yang H, Cui Y, Tang Y, et al. Cytoprotective role of humanin in lens epithelial cell oxidative stress‑induced injury[J]. Mol Med Rep, 2020, 22(2):1467-1479. DOI: 10.3892/mmr.2020.11202.
[4] Hsueh YJ, Meir YJ, Yeh LK, et al. Topical ascorbic acid ameliorates oxidative stress-induced corneal endothelial damage via suppression of apoptosis and autophagic flux blockage[J/OL]. Cells, 2020, 9(4):943[2021-05-18]. http://www.ncbi.nlm.nih.gov/pubmed/32290365. DOI: 10.3390/cells9040943.
[5] Tyc KM, Wong A, Scott RT Jr, et al. Analysis of DNA variants in miRNAs and miRNA 3’UTR binding sites in female infertility patients[J]. Lab Invest, 2021, 101(4):503-512. DOI: 10.1038/s41374-020-00498-x.
[6] Li XT, Qin Y, Zhao JY, et al. Inhibitory effects of microRNA-133b on ultraviolet-induced apoptosis of lens epithelial cells and its mechanism[J]. Chin J Exp Ophthalmol, 2017, 35(11): 977-983. DOI: 10.3760/cma.j.issn.2095-0160. 2017.11.005.
[7] Shen Q, Zhou T. Knockdown of lncRNA TUG1 protects lens epithelial cells from oxidative stress-induced injury by regulating miR-196a-5p expression in age-related cataracts[J/OL]. Exp Ther Med, 2021, 22(5):1286[2021-09-16]. http://www.ncbi.nlm.nih.gov/pubmed/34630641. DOI: 10.3892/etm.2021.10721.
[8] Abdullah OA, El Gazzar WB, Salem TI, et al. miR-15a: a potential diagnostic biomarker and a candidate for non-operative therapeutic modality for age-related cataract[J]. Br J Biomed Sci, 2019, 76(4):184-189. DOI: 10.1080/09674845.2019. 1639337.
[9] Cho H, Hwang M, Hong EH, et al. Micro-RNAs in the aqueous humour of patients with diabetic macular oedema[J]. Clin Exp Ophthalmol, 2020, 48(5):624-635. DOI: 10.1111/ceo.13750.
[10] Shi J, Tang C, Lv HB. Anti-inflammatory and anti-angiogenic effect of miR-15a on diabetic retinopathy[J]. Acta Med Univ Sci Technol Huazhong, 2017, 46(4):443-448. DOI: 10.3870/j.issn.1672-0741.2017.04.014.
[11] Li Y, Liu S, Zhang F, et al. Expression of the microRNAs hsa-miR-15a and hsa-miR-16-1 in lens epithelial cells of patients with age-related cataract[J]. Int J Clin Exp Med, 2015, 8(2):2405-2410.
[12] Liu SJ, Wang WT, Zhang FL, et al. miR‑15a‑3p affects the proliferation, migration and apoptosis of lens epithelial cells[J]. Mol Med Rep, 2019, 19(2):1110-1116. DOI: 10.3892/mmr.2018.9738.
[13] Xie DD, Du SS, Qi Y, et al. The inhibitory effect of decorin on apoptosis of human lens epithelial cells under high glucose condition and its mechanism[J]. Chin J Exp Ophthalmol, 2019, 37(4):252-256. DOI: 10.3760/cma.j.issn.2095- 0160.2019.04.003.
[14] Brennan L, Khoury J, Kantorow M. Parkin elimination of mitochondria is important for maintenance of lens epithelial cell ROS levels and survival upon oxidative stress exposure[J]. Biochim Biophys Acta Mol Basis Dis, 2017, 1863(1):21-32. DOI: 10.1016/j.bbadis.2016.09.020
[15] Bahia S, Blais E, Murugkar S, et al. Oxidative and nitrative stress-related changes in human lens epithelial cells following exposure to X-rays[J]. Int J Radiat Biol, 2018, 94(4):366-373. DOI: 10.1080/09553002.2018.1439194.
[16] Kamalden TA, Macgregor-Das AM, Kannan SM, et al. Exosomal microRNA-15a transfer from the pancreas augments diabetic complications by inducing oxidative stress[J]. Antioxid Redox Signal, 2017, 27(13):913-930. DOI: 10.1089/ars.2016.6844.
[17] Cao Y, Zhang D, Moon HG, et al. MiR-15a/16 regulates apoptosis of lung epithelial cells after oxidative stress[J]. Mol Med, 2016, 22:233-243. DOI: 10.2119/molmed.2015.00136.
[18] Ma F, Wu J, Jiang Z, et al. P53/NRF2 mediates SIRT1’s protective effect on diabetic nephropathy[J]. Biochim Biophys Acta Mol Cell Res, 2019, 1866(8):1272-1281. DOI: 10.1016/j.bbamcr.2019.04.006.
[19] Maiese K. Targeting the core of neurodegeneration: FoxO, mTOR, and SIRT1[J]. Neural Regen Res, 2021, 16(3):448-455. DOI: 10.4103/1673-5374.291382.
[20] Zeng K, Feng QG, Lin BT, et al. Effects of microRNA-211 on proliferation and apoptosis of lens epithelial cells by targeting SIRT1 gene in diabetic cataract mice[J/OL]. Biosci Rep, 2017, 37(4):BSR20170695[2021-08-28]. http://www. ncbi.nlm.nih.gov/pubmed/28679650. DOI: 10.1042/BSR20170695.
[21] Liu HN, Chen XL, Wu N. Preliminary study on serum microRNA expression profile in patients with diabetic retinopathy[J]. Chin J Ophthalmol Med (Electronic Edition), 2019, 9(4):246-251. DOI: 10.3877/cma.j.issn.2095-2007. 2019.04.009.
[22] Chen H, Hu X, Yang R, et al. SIRT1/FOXO3a axis plays an important role in the prevention of mandibular bone loss induced by 1,25(OH)2D deficiency[J]. Int J Biol Sci, 2020, 16(14):2712-2726. DOI: 10.7150/ijbs.48169.
[23] Raju I, Kannan K, Abraham EC. FoxO3a serves as a biomarker of oxidative stress in human lens epithelial cells under conditions of hyperglycemia[J/OL]. PLoS One, 2013, 8(6):e67126[2021-08-28]. http://www.ncbi.nlm.nih.gov/ pubmed/23805295. DOI: 10.1371/journal.pone.0067126.
[24] Xu K, Wu S, Li Z, et al. Expression of SIRT1 and P53 in rat lens epithelial cells in experimentally induced DM[J]. Curr Eye Res, 2018, 43(4):493-498. DOI: 10.1080/02713683.2017.1410178.